Pakistani vs Puerto Rican In Labor Force | Age 25-29
COMPARE
Pakistani
Puerto Rican
In Labor Force | Age 25-29
In Labor Force | Age 25-29 Comparison
Pakistanis
Puerto Ricans
84.8%
IN LABOR FORCE | AGE 25-29
70.0/ 100
METRIC RATING
142nd/ 347
METRIC RANK
80.4%
IN LABOR FORCE | AGE 25-29
0.0/ 100
METRIC RATING
330th/ 347
METRIC RANK
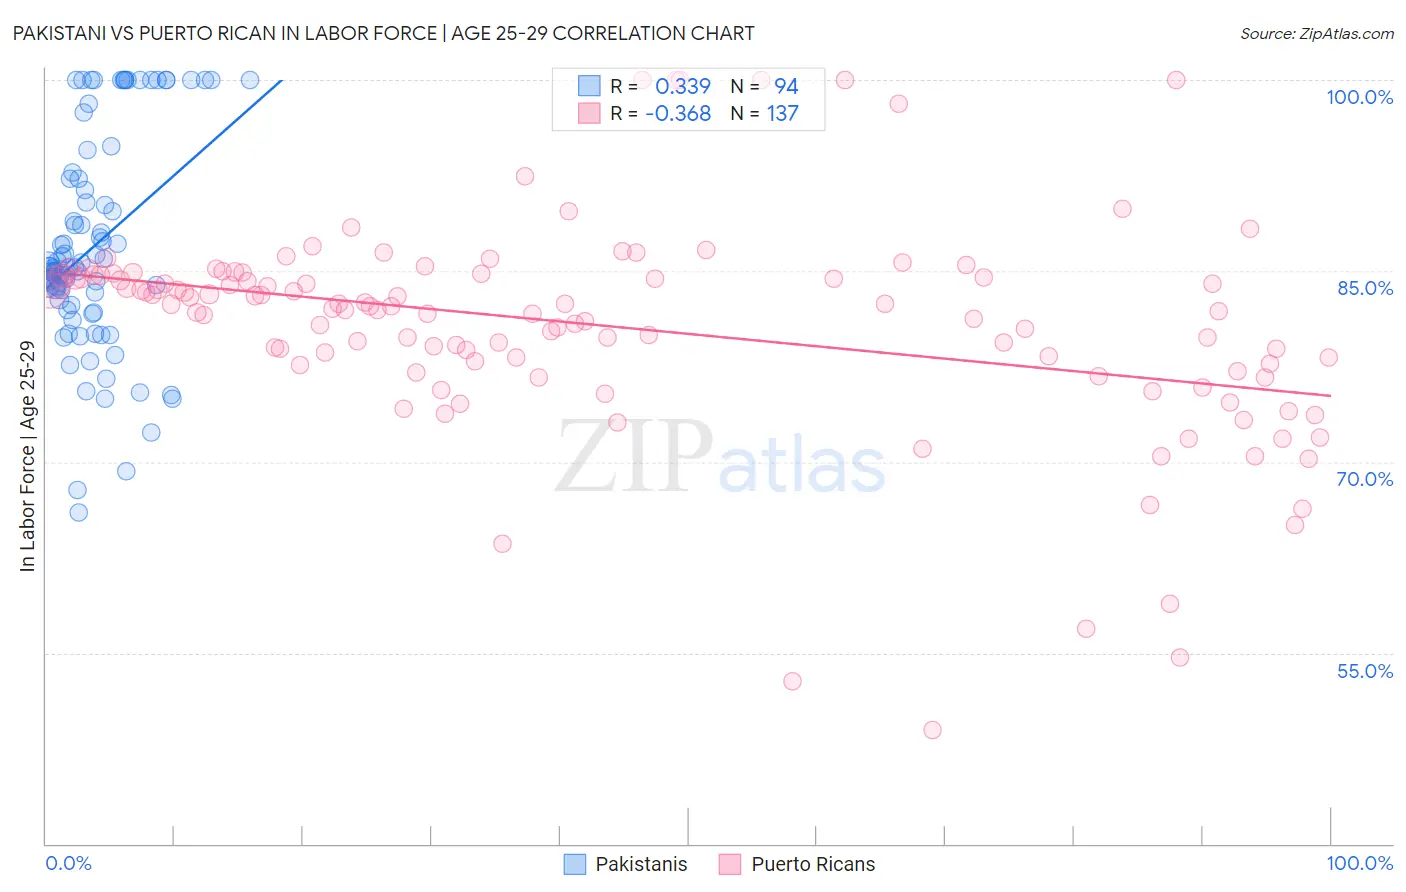
Pakistani vs Puerto Rican In Labor Force | Age 25-29 Correlation Chart
The statistical analysis conducted on geographies consisting of 335,283,437 people shows a mild positive correlation between the proportion of Pakistanis and labor force participation rate among population between the ages 25 and 29 in the United States with a correlation coefficient (R) of 0.339 and weighted average of 84.8%. Similarly, the statistical analysis conducted on geographies consisting of 527,795,348 people shows a mild negative correlation between the proportion of Puerto Ricans and labor force participation rate among population between the ages 25 and 29 in the United States with a correlation coefficient (R) of -0.368 and weighted average of 80.4%, a difference of 5.4%.
In Labor Force | Age 25-29 Correlation Summary
| Measurement | Pakistani | Puerto Rican |
| Minimum | 66.0% | 48.9% |
| Maximum | 100.0% | 100.0% |
| Range | 34.0% | 51.1% |
| Mean | 87.0% | 80.7% |
| Median | 85.2% | 82.2% |
| Interquartile 25% (IQ1) | 82.3% | 77.7% |
| Interquartile 75% (IQ3) | 92.2% | 84.6% |
| Interquartile Range (IQR) | 9.9% | 6.9% |
| Standard Deviation (Sample) | 8.4% | 8.4% |
| Standard Deviation (Population) | 8.3% | 8.3% |
Similar Demographics by In Labor Force | Age 25-29
Demographics Similar to Pakistanis by In Labor Force | Age 25-29
In terms of in labor force | age 25-29, the demographic groups most similar to Pakistanis are Sri Lankan (84.8%, a difference of 0.010%), Immigrants from Laos (84.8%, a difference of 0.010%), Immigrants from Senegal (84.8%, a difference of 0.010%), Armenian (84.8%, a difference of 0.020%), and Immigrants from Eastern Asia (84.8%, a difference of 0.020%).
| Demographics | Rating | Rank | In Labor Force | Age 25-29 |
| Immigrants | Hungary | 76.4 /100 | #135 | Good 84.8% |
| Bhutanese | 76.0 /100 | #136 | Good 84.8% |
| Immigrants | Canada | 73.5 /100 | #137 | Good 84.8% |
| Armenians | 72.7 /100 | #138 | Good 84.8% |
| Immigrants | Eastern Asia | 72.6 /100 | #139 | Good 84.8% |
| Immigrants | North America | 72.1 /100 | #140 | Good 84.8% |
| Danes | 71.9 /100 | #141 | Good 84.8% |
| Pakistanis | 70.0 /100 | #142 | Good 84.8% |
| Sri Lankans | 69.2 /100 | #143 | Good 84.8% |
| Immigrants | Laos | 69.0 /100 | #144 | Good 84.8% |
| Immigrants | Senegal | 68.3 /100 | #145 | Good 84.8% |
| Icelanders | 68.2 /100 | #146 | Good 84.8% |
| Immigrants | Asia | 68.2 /100 | #147 | Good 84.8% |
| Immigrants | England | 65.2 /100 | #148 | Good 84.7% |
| Peruvians | 64.7 /100 | #149 | Good 84.7% |
Demographics Similar to Puerto Ricans by In Labor Force | Age 25-29
In terms of in labor force | age 25-29, the demographic groups most similar to Puerto Ricans are Cheyenne (80.3%, a difference of 0.14%), Yakama (80.6%, a difference of 0.23%), Creek (80.7%, a difference of 0.34%), Ute (80.8%, a difference of 0.48%), and Choctaw (81.0%, a difference of 0.69%).
| Demographics | Rating | Rank | In Labor Force | Age 25-29 |
| Alaska Natives | 0.0 /100 | #323 | Tragic 81.6% |
| Houma | 0.0 /100 | #324 | Tragic 81.2% |
| Dutch West Indians | 0.0 /100 | #325 | Tragic 81.1% |
| Choctaw | 0.0 /100 | #326 | Tragic 81.0% |
| Ute | 0.0 /100 | #327 | Tragic 80.8% |
| Creek | 0.0 /100 | #328 | Tragic 80.7% |
| Yakama | 0.0 /100 | #329 | Tragic 80.6% |
| Puerto Ricans | 0.0 /100 | #330 | Tragic 80.4% |
| Cheyenne | 0.0 /100 | #331 | Tragic 80.3% |
| Inupiat | 0.0 /100 | #332 | Tragic 79.8% |
| Sioux | 0.0 /100 | #333 | Tragic 79.7% |
| Yuman | 0.0 /100 | #334 | Tragic 79.3% |
| Natives/Alaskans | 0.0 /100 | #335 | Tragic 79.3% |
| Apache | 0.0 /100 | #336 | Tragic 79.2% |
| Crow | 0.0 /100 | #337 | Tragic 78.6% |