Scotch-Irish vs Immigrants from Denmark Doctorate Degree
COMPARE
Scotch-Irish
Immigrants from Denmark
Doctorate Degree
Doctorate Degree Comparison
Scotch-Irish
Immigrants from Denmark
1.9%
DOCTORATE DEGREE
63.6/ 100
METRIC RATING
165th/ 347
METRIC RANK
2.8%
DOCTORATE DEGREE
100.0/ 100
METRIC RATING
23rd/ 347
METRIC RANK
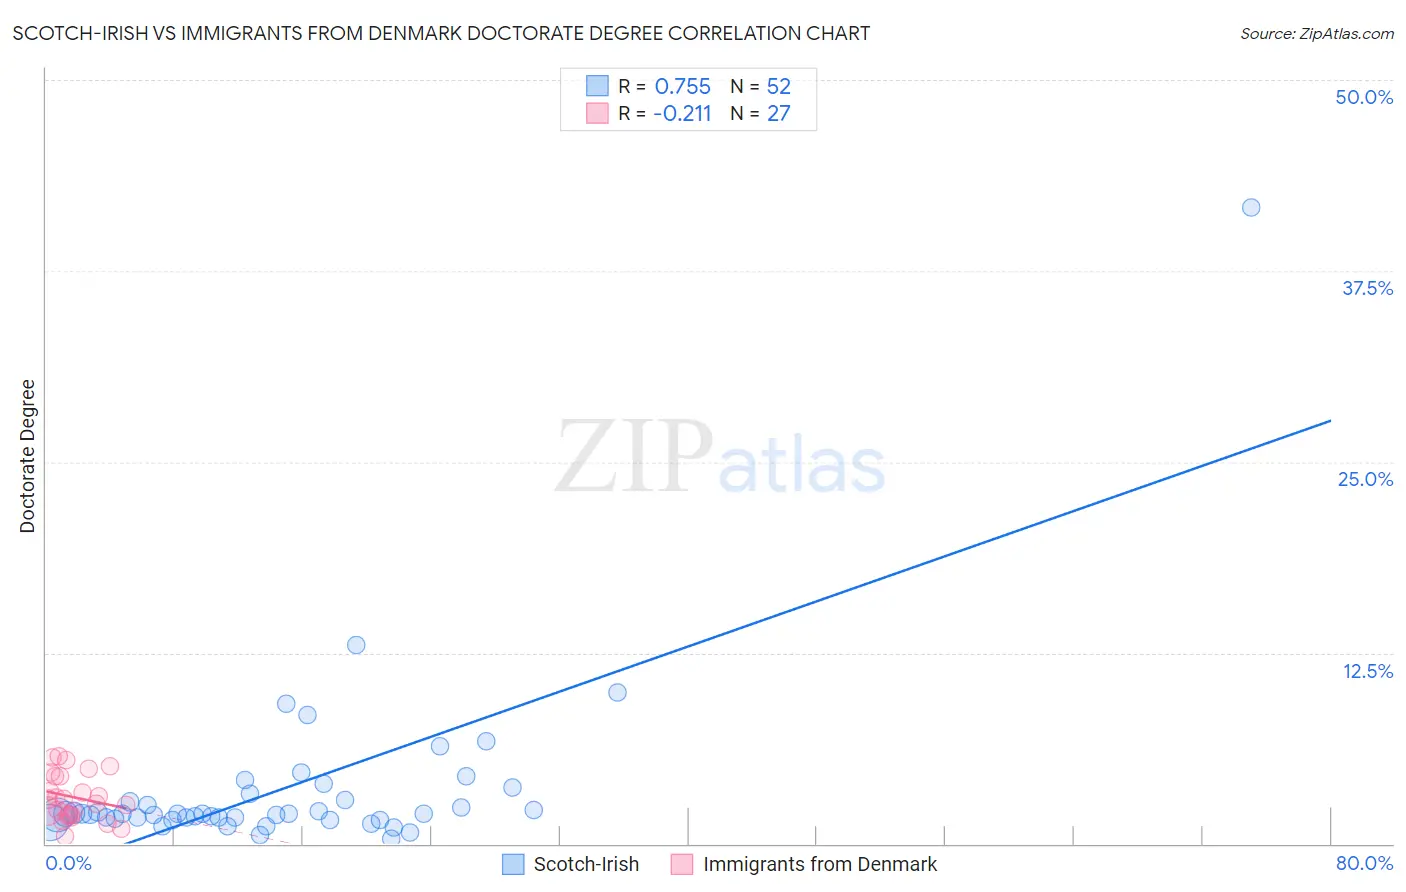
Scotch-Irish vs Immigrants from Denmark Doctorate Degree Correlation Chart
The statistical analysis conducted on geographies consisting of 527,994,945 people shows a strong positive correlation between the proportion of Scotch-Irish and percentage of population with at least doctorate degree education in the United States with a correlation coefficient (R) of 0.755 and weighted average of 1.9%. Similarly, the statistical analysis conducted on geographies consisting of 136,129,405 people shows a weak negative correlation between the proportion of Immigrants from Denmark and percentage of population with at least doctorate degree education in the United States with a correlation coefficient (R) of -0.211 and weighted average of 2.8%, a difference of 46.9%.
Doctorate Degree Correlation Summary
| Measurement | Scotch-Irish | Immigrants from Denmark |
| Minimum | 0.30% | 0.53% |
| Maximum | 41.7% | 5.7% |
| Range | 41.4% | 5.2% |
| Mean | 3.6% | 3.1% |
| Median | 1.9% | 2.9% |
| Interquartile 25% (IQ1) | 1.7% | 1.9% |
| Interquartile 75% (IQ3) | 3.1% | 4.5% |
| Interquartile Range (IQR) | 1.4% | 2.6% |
| Standard Deviation (Sample) | 5.9% | 1.5% |
| Standard Deviation (Population) | 5.9% | 1.5% |
Similar Demographics by Doctorate Degree
Demographics Similar to Scotch-Irish by Doctorate Degree
In terms of doctorate degree, the demographic groups most similar to Scotch-Irish are Spaniard (1.9%, a difference of 0.020%), Macedonian (1.9%, a difference of 0.41%), Celtic (1.9%, a difference of 0.49%), Sri Lankan (1.9%, a difference of 0.51%), and Czech (1.9%, a difference of 0.58%).
| Demographics | Rating | Rank | Doctorate Degree |
| Hungarians | 71.7 /100 | #158 | Good 1.9% |
| Slovenes | 70.2 /100 | #159 | Good 1.9% |
| Welsh | 69.7 /100 | #160 | Good 1.9% |
| Immigrants | Middle Africa | 68.8 /100 | #161 | Good 1.9% |
| Irish | 67.5 /100 | #162 | Good 1.9% |
| Czechs | 67.3 /100 | #163 | Good 1.9% |
| Celtics | 66.7 /100 | #164 | Good 1.9% |
| Scotch-Irish | 63.6 /100 | #165 | Good 1.9% |
| Spaniards | 63.5 /100 | #166 | Good 1.9% |
| Macedonians | 60.9 /100 | #167 | Good 1.9% |
| Sri Lankans | 60.3 /100 | #168 | Good 1.9% |
| Vietnamese | 54.8 /100 | #169 | Average 1.9% |
| Costa Ricans | 53.3 /100 | #170 | Average 1.8% |
| Bermudans | 52.1 /100 | #171 | Average 1.8% |
| Belgians | 50.3 /100 | #172 | Average 1.8% |
Demographics Similar to Immigrants from Denmark by Doctorate Degree
In terms of doctorate degree, the demographic groups most similar to Immigrants from Denmark are Mongolian (2.8%, a difference of 0.13%), Thai (2.8%, a difference of 0.33%), Immigrants from Hong Kong (2.8%, a difference of 0.68%), Immigrants from Japan (2.8%, a difference of 1.0%), and Israeli (2.7%, a difference of 1.3%).
| Demographics | Rating | Rank | Doctorate Degree |
| Eastern Europeans | 100.0 /100 | #16 | Exceptional 2.8% |
| Immigrants | Australia | 100.0 /100 | #17 | Exceptional 2.8% |
| Immigrants | Sri Lanka | 100.0 /100 | #18 | Exceptional 2.8% |
| Immigrants | Japan | 100.0 /100 | #19 | Exceptional 2.8% |
| Immigrants | Hong Kong | 100.0 /100 | #20 | Exceptional 2.8% |
| Thais | 100.0 /100 | #21 | Exceptional 2.8% |
| Mongolians | 100.0 /100 | #22 | Exceptional 2.8% |
| Immigrants | Denmark | 100.0 /100 | #23 | Exceptional 2.8% |
| Israelis | 100.0 /100 | #24 | Exceptional 2.7% |
| Immigrants | Saudi Arabia | 100.0 /100 | #25 | Exceptional 2.7% |
| Turks | 100.0 /100 | #26 | Exceptional 2.7% |
| Immigrants | Turkey | 100.0 /100 | #27 | Exceptional 2.6% |
| Burmese | 100.0 /100 | #28 | Exceptional 2.6% |
| Immigrants | South Central Asia | 100.0 /100 | #29 | Exceptional 2.6% |
| Immigrants | Korea | 100.0 /100 | #30 | Exceptional 2.6% |