Scotch-Irish vs Immigrants from Denmark Unemployment Among Women with Children Ages 6 to 17 years
COMPARE
Scotch-Irish
Immigrants from Denmark
Unemployment Among Women with Children Ages 6 to 17 years
Unemployment Among Women with Children Ages 6 to 17 years Comparison
Scotch-Irish
Immigrants from Denmark
9.7%
UNEMPLOYMENT AMONG WOMEN WITH CHILDREN AGES 6 TO 17 YEARS
0.1/ 100
METRIC RATING
279th/ 347
METRIC RANK
8.7%
UNEMPLOYMENT AMONG WOMEN WITH CHILDREN AGES 6 TO 17 YEARS
95.5/ 100
METRIC RATING
121st/ 347
METRIC RANK
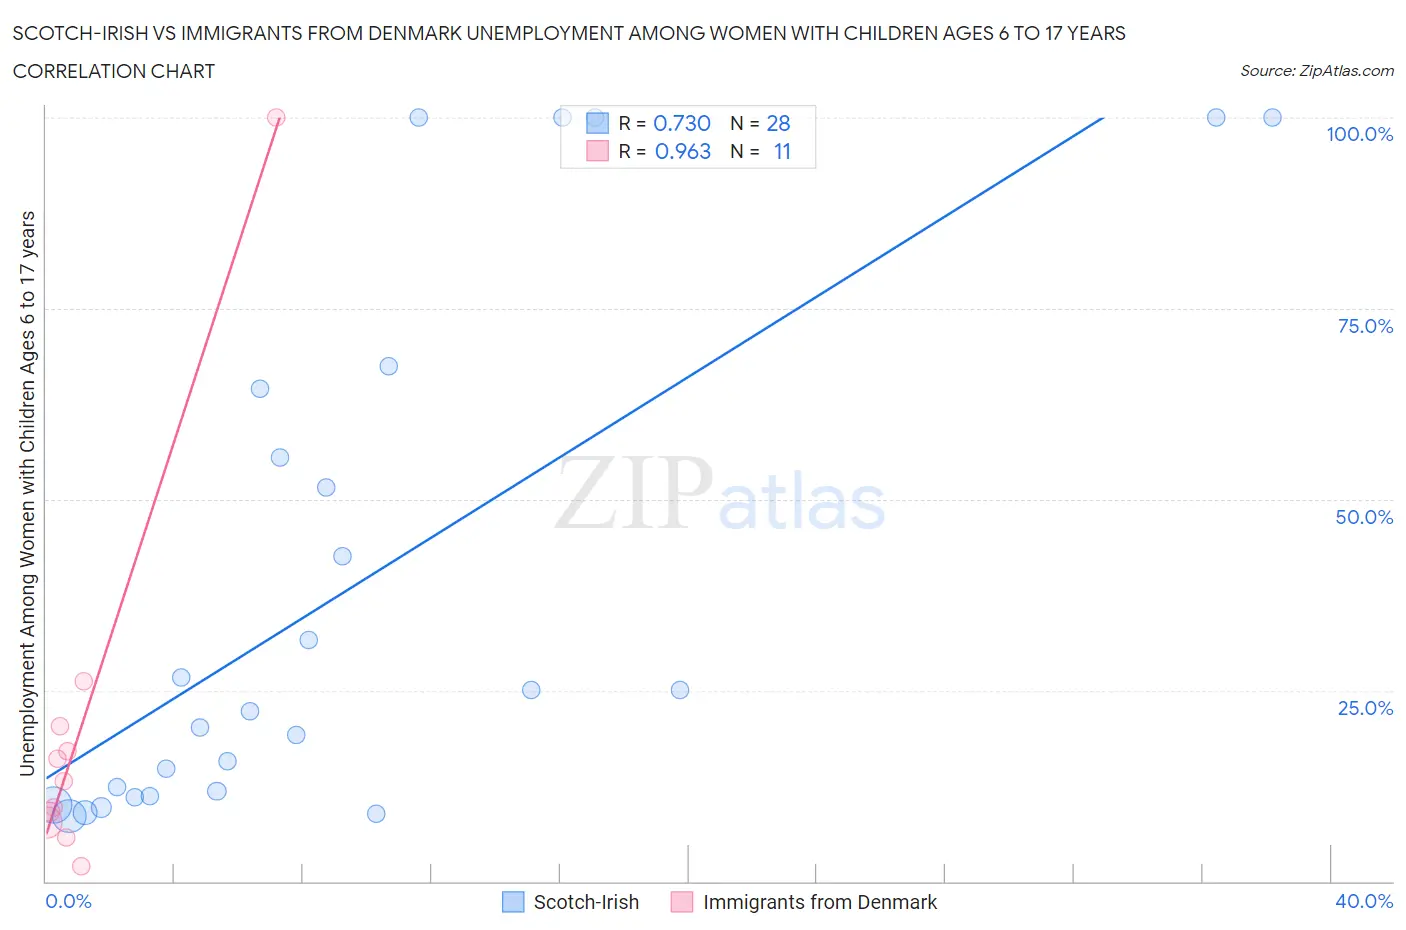
Scotch-Irish vs Immigrants from Denmark Unemployment Among Women with Children Ages 6 to 17 years Correlation Chart
The statistical analysis conducted on geographies consisting of 346,014,789 people shows a strong positive correlation between the proportion of Scotch-Irish and unemployment rate among women with children between the ages 6 and 17 in the United States with a correlation coefficient (R) of 0.730 and weighted average of 9.7%. Similarly, the statistical analysis conducted on geographies consisting of 113,144,957 people shows a perfect positive correlation between the proportion of Immigrants from Denmark and unemployment rate among women with children between the ages 6 and 17 in the United States with a correlation coefficient (R) of 0.963 and weighted average of 8.7%, a difference of 12.0%.
Unemployment Among Women with Children Ages 6 to 17 years Correlation Summary
| Measurement | Scotch-Irish | Immigrants from Denmark |
| Minimum | 8.6% | 2.0% |
| Maximum | 100.0% | 100.0% |
| Range | 91.4% | 98.0% |
| Mean | 38.4% | 20.6% |
| Median | 23.6% | 13.1% |
| Interquartile 25% (IQ1) | 11.4% | 7.7% |
| Interquartile 75% (IQ3) | 60.0% | 20.3% |
| Interquartile Range (IQR) | 48.6% | 12.6% |
| Standard Deviation (Sample) | 33.7% | 27.2% |
| Standard Deviation (Population) | 33.1% | 26.0% |
Similar Demographics by Unemployment Among Women with Children Ages 6 to 17 years
Demographics Similar to Scotch-Irish by Unemployment Among Women with Children Ages 6 to 17 years
In terms of unemployment among women with children ages 6 to 17 years, the demographic groups most similar to Scotch-Irish are French (9.7%, a difference of 0.030%), British West Indian (9.7%, a difference of 0.11%), Immigrants from Portugal (9.7%, a difference of 0.16%), U.S. Virgin Islander (9.7%, a difference of 0.17%), and Seminole (9.7%, a difference of 0.19%).
| Demographics | Rating | Rank | Unemployment Among Women with Children Ages 6 to 17 years |
| Kiowa | 0.1 /100 | #272 | Tragic 9.6% |
| Whites/Caucasians | 0.1 /100 | #273 | Tragic 9.6% |
| Aleuts | 0.1 /100 | #274 | Tragic 9.6% |
| U.S. Virgin Islanders | 0.1 /100 | #275 | Tragic 9.7% |
| Immigrants | Portugal | 0.1 /100 | #276 | Tragic 9.7% |
| British West Indians | 0.1 /100 | #277 | Tragic 9.7% |
| French | 0.1 /100 | #278 | Tragic 9.7% |
| Scotch-Irish | 0.1 /100 | #279 | Tragic 9.7% |
| Seminole | 0.1 /100 | #280 | Tragic 9.7% |
| Jamaicans | 0.0 /100 | #281 | Tragic 9.8% |
| Slovaks | 0.0 /100 | #282 | Tragic 9.8% |
| Central American Indians | 0.0 /100 | #283 | Tragic 9.9% |
| Yakama | 0.0 /100 | #284 | Tragic 9.9% |
| Hispanics or Latinos | 0.0 /100 | #285 | Tragic 9.9% |
| Choctaw | 0.0 /100 | #286 | Tragic 9.9% |
Demographics Similar to Immigrants from Denmark by Unemployment Among Women with Children Ages 6 to 17 years
In terms of unemployment among women with children ages 6 to 17 years, the demographic groups most similar to Immigrants from Denmark are Israeli (8.7%, a difference of 0.11%), Immigrants from Egypt (8.7%, a difference of 0.12%), Immigrants from Morocco (8.7%, a difference of 0.16%), Immigrants from Lebanon (8.7%, a difference of 0.16%), and Immigrants from Grenada (8.6%, a difference of 0.19%).
| Demographics | Rating | Rank | Unemployment Among Women with Children Ages 6 to 17 years |
| Immigrants | Russia | 96.7 /100 | #114 | Exceptional 8.6% |
| Argentineans | 96.5 /100 | #115 | Exceptional 8.6% |
| Zimbabweans | 96.3 /100 | #116 | Exceptional 8.6% |
| Albanians | 96.3 /100 | #117 | Exceptional 8.6% |
| Pueblo | 96.2 /100 | #118 | Exceptional 8.6% |
| Immigrants | Grenada | 96.2 /100 | #119 | Exceptional 8.6% |
| Israelis | 95.9 /100 | #120 | Exceptional 8.7% |
| Immigrants | Denmark | 95.5 /100 | #121 | Exceptional 8.7% |
| Immigrants | Egypt | 95.0 /100 | #122 | Exceptional 8.7% |
| Immigrants | Morocco | 94.9 /100 | #123 | Exceptional 8.7% |
| Immigrants | Lebanon | 94.9 /100 | #124 | Exceptional 8.7% |
| South Africans | 94.6 /100 | #125 | Exceptional 8.7% |
| Immigrants | Northern Africa | 94.4 /100 | #126 | Exceptional 8.7% |
| Czechs | 94.4 /100 | #127 | Exceptional 8.7% |
| Hmong | 94.3 /100 | #128 | Exceptional 8.7% |