Samoan vs U.S. Virgin Islander In Labor Force | Age 16-19
COMPARE
Samoan
U.S. Virgin Islander
In Labor Force | Age 16-19
In Labor Force | Age 16-19 Comparison
Samoans
U.S. Virgin Islanders
39.1%
IN LABOR FORCE | AGE 16-19
99.6/ 100
METRIC RATING
86th/ 347
METRIC RANK
33.6%
IN LABOR FORCE | AGE 16-19
0.2/ 100
METRIC RATING
285th/ 347
METRIC RANK
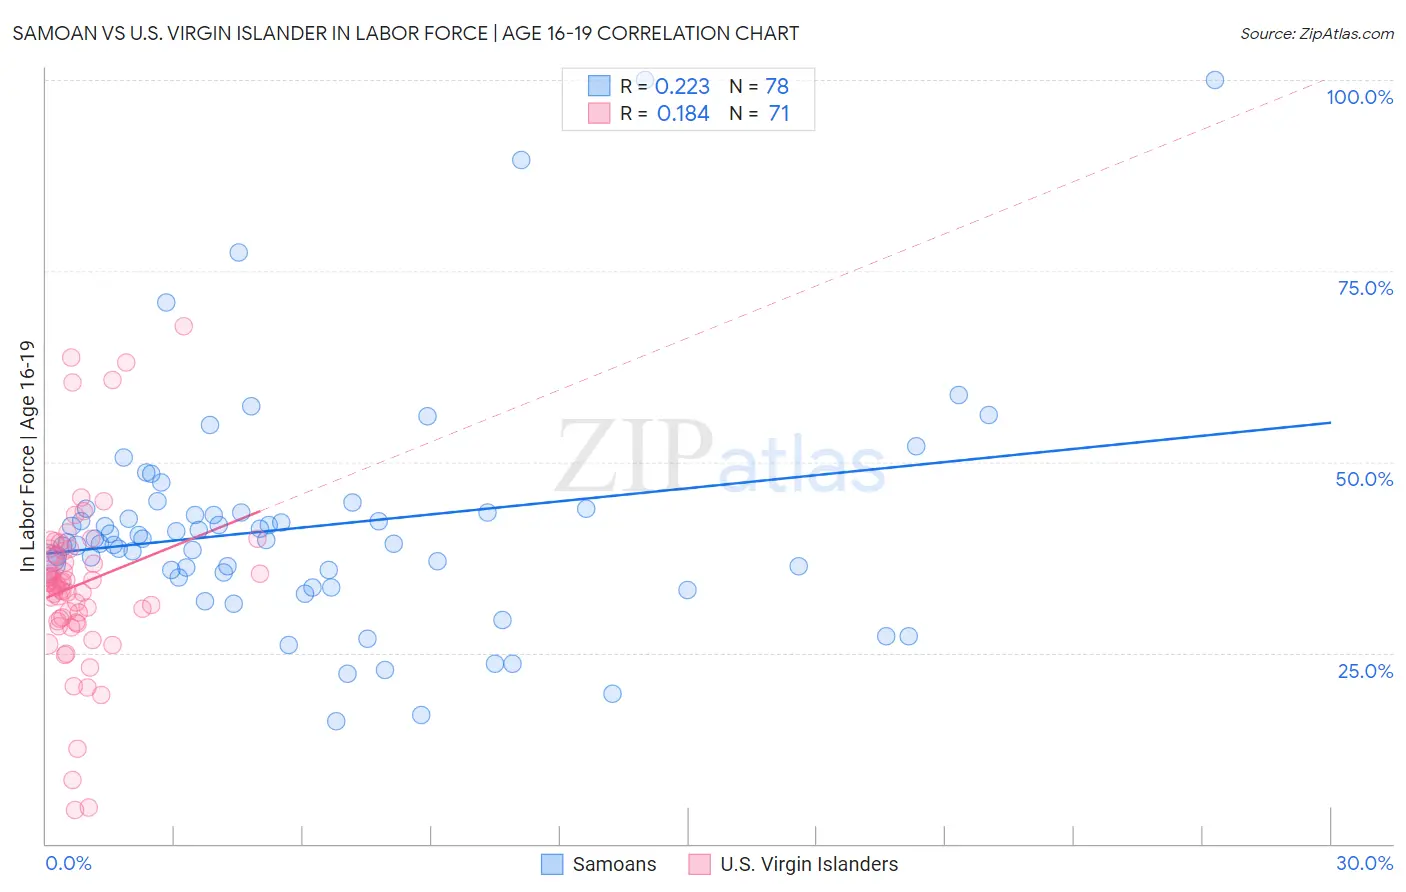
Samoan vs U.S. Virgin Islander In Labor Force | Age 16-19 Correlation Chart
The statistical analysis conducted on geographies consisting of 225,011,822 people shows a weak positive correlation between the proportion of Samoans and labor force participation rate among population between the ages 16 and 19 in the United States with a correlation coefficient (R) of 0.223 and weighted average of 39.1%. Similarly, the statistical analysis conducted on geographies consisting of 87,491,211 people shows a poor positive correlation between the proportion of U.S. Virgin Islanders and labor force participation rate among population between the ages 16 and 19 in the United States with a correlation coefficient (R) of 0.184 and weighted average of 33.6%, a difference of 16.4%.
In Labor Force | Age 16-19 Correlation Summary
| Measurement | Samoan | U.S. Virgin Islander |
| Minimum | 16.0% | 4.4% |
| Maximum | 100.0% | 67.8% |
| Range | 84.0% | 63.4% |
| Mean | 41.6% | 34.0% |
| Median | 39.5% | 33.9% |
| Interquartile 25% (IQ1) | 35.5% | 29.1% |
| Interquartile 75% (IQ3) | 43.3% | 38.3% |
| Interquartile Range (IQR) | 7.9% | 9.2% |
| Standard Deviation (Sample) | 15.2% | 11.4% |
| Standard Deviation (Population) | 15.1% | 11.4% |
Similar Demographics by In Labor Force | Age 16-19
Demographics Similar to Samoans by In Labor Force | Age 16-19
In terms of in labor force | age 16-19, the demographic groups most similar to Samoans are Creek (39.1%, a difference of 0.020%), Immigrants from Germany (39.1%, a difference of 0.080%), Puget Sound Salish (39.1%, a difference of 0.16%), Alaska Native (39.1%, a difference of 0.16%), and Immigrants from Uganda (39.2%, a difference of 0.17%).
| Demographics | Rating | Rank | In Labor Force | Age 16-19 |
| Marshallese | 99.8 /100 | #79 | Exceptional 39.5% |
| Immigrants | Iraq | 99.8 /100 | #80 | Exceptional 39.4% |
| Shoshone | 99.7 /100 | #81 | Exceptional 39.3% |
| Basques | 99.7 /100 | #82 | Exceptional 39.3% |
| Spanish | 99.7 /100 | #83 | Exceptional 39.3% |
| Immigrants | Uganda | 99.7 /100 | #84 | Exceptional 39.2% |
| Creek | 99.6 /100 | #85 | Exceptional 39.1% |
| Samoans | 99.6 /100 | #86 | Exceptional 39.1% |
| Immigrants | Germany | 99.6 /100 | #87 | Exceptional 39.1% |
| Puget Sound Salish | 99.6 /100 | #88 | Exceptional 39.1% |
| Alaska Natives | 99.6 /100 | #89 | Exceptional 39.1% |
| Immigrants | Burma/Myanmar | 99.5 /100 | #90 | Exceptional 39.0% |
| Spanish Americans | 99.5 /100 | #91 | Exceptional 39.0% |
| Osage | 99.4 /100 | #92 | Exceptional 39.0% |
| Blackfeet | 99.4 /100 | #93 | Exceptional 38.9% |
Demographics Similar to U.S. Virgin Islanders by In Labor Force | Age 16-19
In terms of in labor force | age 16-19, the demographic groups most similar to U.S. Virgin Islanders are South American (33.6%, a difference of 0.080%), Immigrants from Spain (33.7%, a difference of 0.19%), Immigrants from Venezuela (33.7%, a difference of 0.25%), Nepalese (33.5%, a difference of 0.31%), and Immigrants from Indonesia (33.5%, a difference of 0.35%).
| Demographics | Rating | Rank | In Labor Force | Age 16-19 |
| Colombians | 0.3 /100 | #278 | Tragic 33.8% |
| Paraguayans | 0.3 /100 | #279 | Tragic 33.8% |
| Taiwanese | 0.3 /100 | #280 | Tragic 33.8% |
| Cypriots | 0.3 /100 | #281 | Tragic 33.8% |
| Immigrants | Korea | 0.3 /100 | #282 | Tragic 33.8% |
| Immigrants | Venezuela | 0.2 /100 | #283 | Tragic 33.7% |
| Immigrants | Spain | 0.2 /100 | #284 | Tragic 33.7% |
| U.S. Virgin Islanders | 0.2 /100 | #285 | Tragic 33.6% |
| South Americans | 0.2 /100 | #286 | Tragic 33.6% |
| Nepalese | 0.1 /100 | #287 | Tragic 33.5% |
| Immigrants | Indonesia | 0.1 /100 | #288 | Tragic 33.5% |
| Immigrants | Singapore | 0.1 /100 | #289 | Tragic 33.5% |
| Immigrants | Colombia | 0.1 /100 | #290 | Tragic 33.5% |
| Immigrants | Belarus | 0.1 /100 | #291 | Tragic 33.4% |
| Haitians | 0.1 /100 | #292 | Tragic 33.4% |