Samoan vs Immigrants In Labor Force | Age 16-19
COMPARE
Samoan
Immigrants
In Labor Force | Age 16-19
In Labor Force | Age 16-19 Comparison
Samoans
Immigrants
39.1%
IN LABOR FORCE | AGE 16-19
99.6/ 100
METRIC RATING
86th/ 347
METRIC RANK
34.6%
IN LABOR FORCE | AGE 16-19
1.2/ 100
METRIC RATING
259th/ 347
METRIC RANK
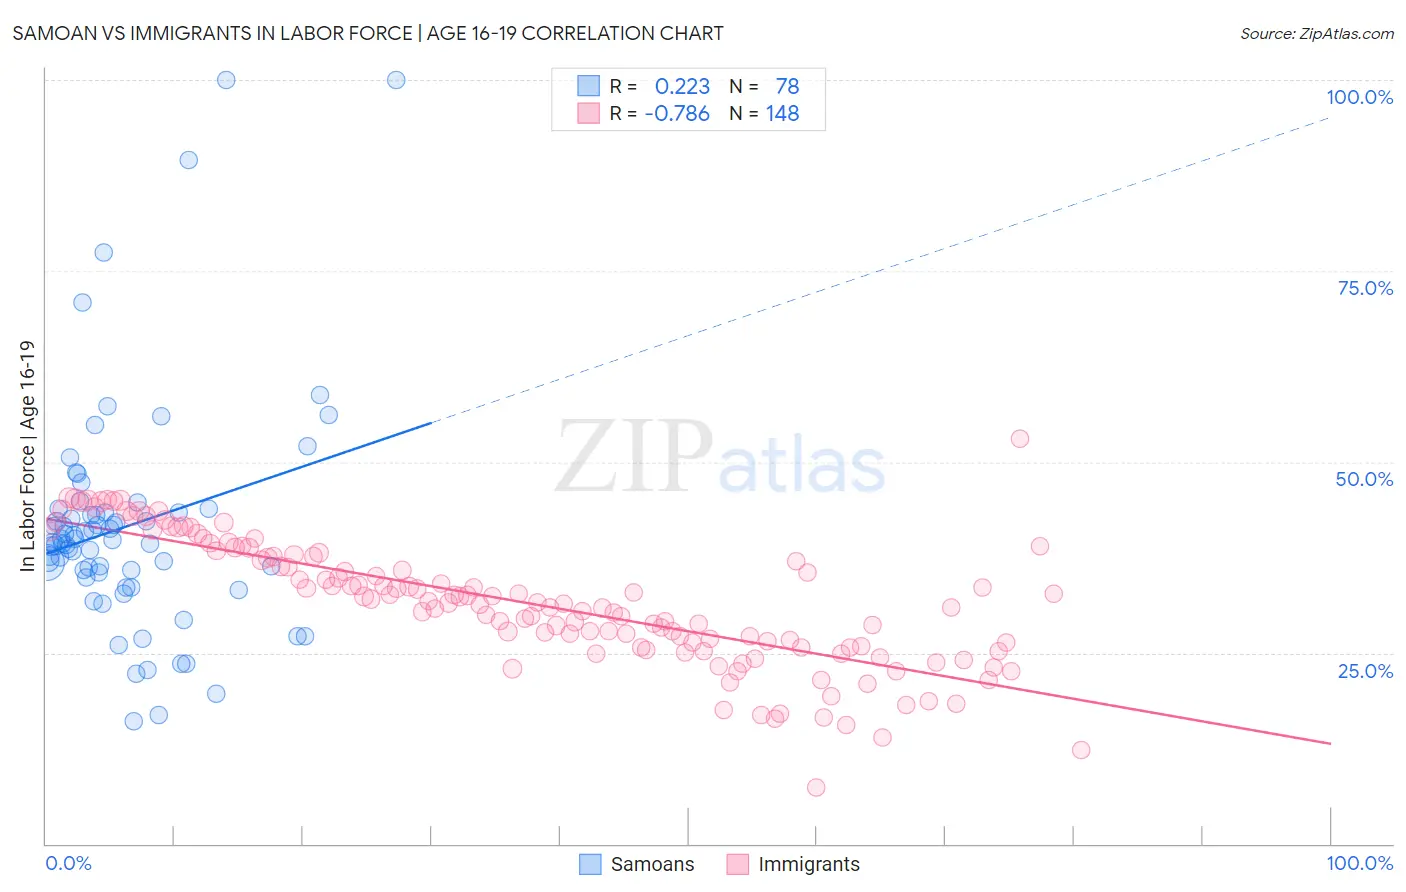
Samoan vs Immigrants In Labor Force | Age 16-19 Correlation Chart
The statistical analysis conducted on geographies consisting of 225,011,822 people shows a weak positive correlation between the proportion of Samoans and labor force participation rate among population between the ages 16 and 19 in the United States with a correlation coefficient (R) of 0.223 and weighted average of 39.1%. Similarly, the statistical analysis conducted on geographies consisting of 573,117,494 people shows a strong negative correlation between the proportion of Immigrants and labor force participation rate among population between the ages 16 and 19 in the United States with a correlation coefficient (R) of -0.786 and weighted average of 34.6%, a difference of 13.3%.
In Labor Force | Age 16-19 Correlation Summary
| Measurement | Samoan | Immigrants |
| Minimum | 16.0% | 7.3% |
| Maximum | 100.0% | 53.1% |
| Range | 84.0% | 45.8% |
| Mean | 41.6% | 31.5% |
| Median | 39.5% | 31.6% |
| Interquartile 25% (IQ1) | 35.5% | 25.8% |
| Interquartile 75% (IQ3) | 43.3% | 37.7% |
| Interquartile Range (IQR) | 7.9% | 12.0% |
| Standard Deviation (Sample) | 15.2% | 8.3% |
| Standard Deviation (Population) | 15.1% | 8.2% |
Similar Demographics by In Labor Force | Age 16-19
Demographics Similar to Samoans by In Labor Force | Age 16-19
In terms of in labor force | age 16-19, the demographic groups most similar to Samoans are Creek (39.1%, a difference of 0.020%), Immigrants from Germany (39.1%, a difference of 0.080%), Puget Sound Salish (39.1%, a difference of 0.16%), Alaska Native (39.1%, a difference of 0.16%), and Immigrants from Uganda (39.2%, a difference of 0.17%).
| Demographics | Rating | Rank | In Labor Force | Age 16-19 |
| Marshallese | 99.8 /100 | #79 | Exceptional 39.5% |
| Immigrants | Iraq | 99.8 /100 | #80 | Exceptional 39.4% |
| Shoshone | 99.7 /100 | #81 | Exceptional 39.3% |
| Basques | 99.7 /100 | #82 | Exceptional 39.3% |
| Spanish | 99.7 /100 | #83 | Exceptional 39.3% |
| Immigrants | Uganda | 99.7 /100 | #84 | Exceptional 39.2% |
| Creek | 99.6 /100 | #85 | Exceptional 39.1% |
| Samoans | 99.6 /100 | #86 | Exceptional 39.1% |
| Immigrants | Germany | 99.6 /100 | #87 | Exceptional 39.1% |
| Puget Sound Salish | 99.6 /100 | #88 | Exceptional 39.1% |
| Alaska Natives | 99.6 /100 | #89 | Exceptional 39.1% |
| Immigrants | Burma/Myanmar | 99.5 /100 | #90 | Exceptional 39.0% |
| Spanish Americans | 99.5 /100 | #91 | Exceptional 39.0% |
| Osage | 99.4 /100 | #92 | Exceptional 39.0% |
| Blackfeet | 99.4 /100 | #93 | Exceptional 38.9% |
Demographics Similar to Immigrants by In Labor Force | Age 16-19
In terms of in labor force | age 16-19, the demographic groups most similar to Immigrants are Immigrants from Egypt (34.6%, a difference of 0.020%), Thai (34.6%, a difference of 0.020%), Immigrants from South Central Asia (34.6%, a difference of 0.030%), Egyptian (34.5%, a difference of 0.080%), and Salvadoran (34.5%, a difference of 0.12%).
| Demographics | Rating | Rank | In Labor Force | Age 16-19 |
| Immigrants | Chile | 2.0 /100 | #252 | Tragic 34.8% |
| Immigrants | Japan | 1.5 /100 | #253 | Tragic 34.7% |
| Bahamians | 1.4 /100 | #254 | Tragic 34.6% |
| Peruvians | 1.4 /100 | #255 | Tragic 34.6% |
| Immigrants | South Central Asia | 1.3 /100 | #256 | Tragic 34.6% |
| Immigrants | Egypt | 1.2 /100 | #257 | Tragic 34.6% |
| Thais | 1.2 /100 | #258 | Tragic 34.6% |
| Immigrants | Immigrants | 1.2 /100 | #259 | Tragic 34.6% |
| Egyptians | 1.2 /100 | #260 | Tragic 34.5% |
| Salvadorans | 1.1 /100 | #261 | Tragic 34.5% |
| Hispanics or Latinos | 1.1 /100 | #262 | Tragic 34.5% |
| Burmese | 1.1 /100 | #263 | Tragic 34.5% |
| Immigrants | Uruguay | 0.9 /100 | #264 | Tragic 34.4% |
| Immigrants | El Salvador | 0.7 /100 | #265 | Tragic 34.3% |
| Immigrants | Malaysia | 0.7 /100 | #266 | Tragic 34.3% |