Immigrants from Uruguay vs U.S. Virgin Islander In Labor Force | Age 16-19
COMPARE
Immigrants from Uruguay
U.S. Virgin Islander
In Labor Force | Age 16-19
In Labor Force | Age 16-19 Comparison
Immigrants from Uruguay
U.S. Virgin Islanders
34.4%
IN LABOR FORCE | AGE 16-19
0.9/ 100
METRIC RATING
264th/ 347
METRIC RANK
33.6%
IN LABOR FORCE | AGE 16-19
0.2/ 100
METRIC RATING
285th/ 347
METRIC RANK
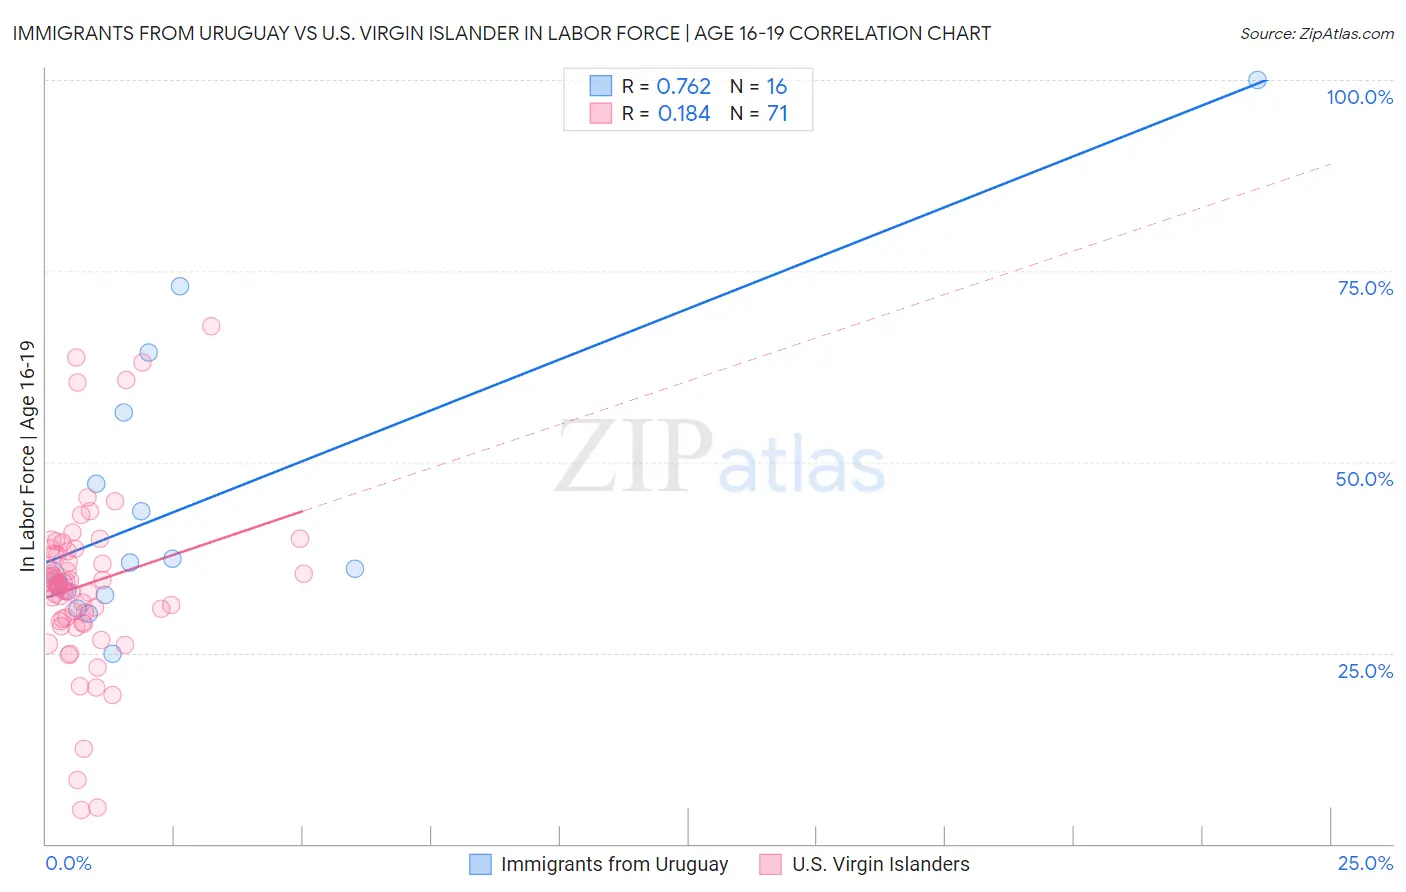
Immigrants from Uruguay vs U.S. Virgin Islander In Labor Force | Age 16-19 Correlation Chart
The statistical analysis conducted on geographies consisting of 133,181,589 people shows a strong positive correlation between the proportion of Immigrants from Uruguay and labor force participation rate among population between the ages 16 and 19 in the United States with a correlation coefficient (R) of 0.762 and weighted average of 34.4%. Similarly, the statistical analysis conducted on geographies consisting of 87,491,211 people shows a poor positive correlation between the proportion of U.S. Virgin Islanders and labor force participation rate among population between the ages 16 and 19 in the United States with a correlation coefficient (R) of 0.184 and weighted average of 33.6%, a difference of 2.3%.
In Labor Force | Age 16-19 Correlation Summary
| Measurement | Immigrants from Uruguay | U.S. Virgin Islander |
| Minimum | 24.8% | 4.4% |
| Maximum | 100.0% | 67.8% |
| Range | 75.2% | 63.4% |
| Mean | 44.7% | 34.0% |
| Median | 36.4% | 33.9% |
| Interquartile 25% (IQ1) | 32.8% | 29.1% |
| Interquartile 75% (IQ3) | 51.8% | 38.3% |
| Interquartile Range (IQR) | 19.0% | 9.2% |
| Standard Deviation (Sample) | 19.8% | 11.4% |
| Standard Deviation (Population) | 19.2% | 11.4% |
Similar Demographics by In Labor Force | Age 16-19
Demographics Similar to Immigrants from Uruguay by In Labor Force | Age 16-19
In terms of in labor force | age 16-19, the demographic groups most similar to Immigrants from Uruguay are Immigrants from El Salvador (34.3%, a difference of 0.24%), Burmese (34.5%, a difference of 0.28%), Hispanic or Latino (34.5%, a difference of 0.32%), Salvadoran (34.5%, a difference of 0.33%), and Immigrants from Malaysia (34.3%, a difference of 0.33%).
| Demographics | Rating | Rank | In Labor Force | Age 16-19 |
| Immigrants | Egypt | 1.2 /100 | #257 | Tragic 34.6% |
| Thais | 1.2 /100 | #258 | Tragic 34.6% |
| Immigrants | Immigrants | 1.2 /100 | #259 | Tragic 34.6% |
| Egyptians | 1.2 /100 | #260 | Tragic 34.5% |
| Salvadorans | 1.1 /100 | #261 | Tragic 34.5% |
| Hispanics or Latinos | 1.1 /100 | #262 | Tragic 34.5% |
| Burmese | 1.1 /100 | #263 | Tragic 34.5% |
| Immigrants | Uruguay | 0.9 /100 | #264 | Tragic 34.4% |
| Immigrants | El Salvador | 0.7 /100 | #265 | Tragic 34.3% |
| Immigrants | Malaysia | 0.7 /100 | #266 | Tragic 34.3% |
| Immigrants | Peru | 0.5 /100 | #267 | Tragic 34.2% |
| Immigrants | Asia | 0.5 /100 | #268 | Tragic 34.1% |
| Pima | 0.5 /100 | #269 | Tragic 34.1% |
| Immigrants | Russia | 0.4 /100 | #270 | Tragic 34.1% |
| Central American Indians | 0.4 /100 | #271 | Tragic 34.1% |
Demographics Similar to U.S. Virgin Islanders by In Labor Force | Age 16-19
In terms of in labor force | age 16-19, the demographic groups most similar to U.S. Virgin Islanders are South American (33.6%, a difference of 0.080%), Immigrants from Spain (33.7%, a difference of 0.19%), Immigrants from Venezuela (33.7%, a difference of 0.25%), Nepalese (33.5%, a difference of 0.31%), and Immigrants from Indonesia (33.5%, a difference of 0.35%).
| Demographics | Rating | Rank | In Labor Force | Age 16-19 |
| Colombians | 0.3 /100 | #278 | Tragic 33.8% |
| Paraguayans | 0.3 /100 | #279 | Tragic 33.8% |
| Taiwanese | 0.3 /100 | #280 | Tragic 33.8% |
| Cypriots | 0.3 /100 | #281 | Tragic 33.8% |
| Immigrants | Korea | 0.3 /100 | #282 | Tragic 33.8% |
| Immigrants | Venezuela | 0.2 /100 | #283 | Tragic 33.7% |
| Immigrants | Spain | 0.2 /100 | #284 | Tragic 33.7% |
| U.S. Virgin Islanders | 0.2 /100 | #285 | Tragic 33.6% |
| South Americans | 0.2 /100 | #286 | Tragic 33.6% |
| Nepalese | 0.1 /100 | #287 | Tragic 33.5% |
| Immigrants | Indonesia | 0.1 /100 | #288 | Tragic 33.5% |
| Immigrants | Singapore | 0.1 /100 | #289 | Tragic 33.5% |
| Immigrants | Colombia | 0.1 /100 | #290 | Tragic 33.5% |
| Immigrants | Belarus | 0.1 /100 | #291 | Tragic 33.4% |
| Haitians | 0.1 /100 | #292 | Tragic 33.4% |