Immigrants from the Azores vs U.S. Virgin Islander In Labor Force | Age 16-19
COMPARE
Immigrants from the Azores
U.S. Virgin Islander
In Labor Force | Age 16-19
In Labor Force | Age 16-19 Comparison
Immigrants from the Azores
U.S. Virgin Islanders
41.7%
IN LABOR FORCE | AGE 16-19
100.0/ 100
METRIC RATING
36th/ 347
METRIC RANK
33.6%
IN LABOR FORCE | AGE 16-19
0.2/ 100
METRIC RATING
285th/ 347
METRIC RANK
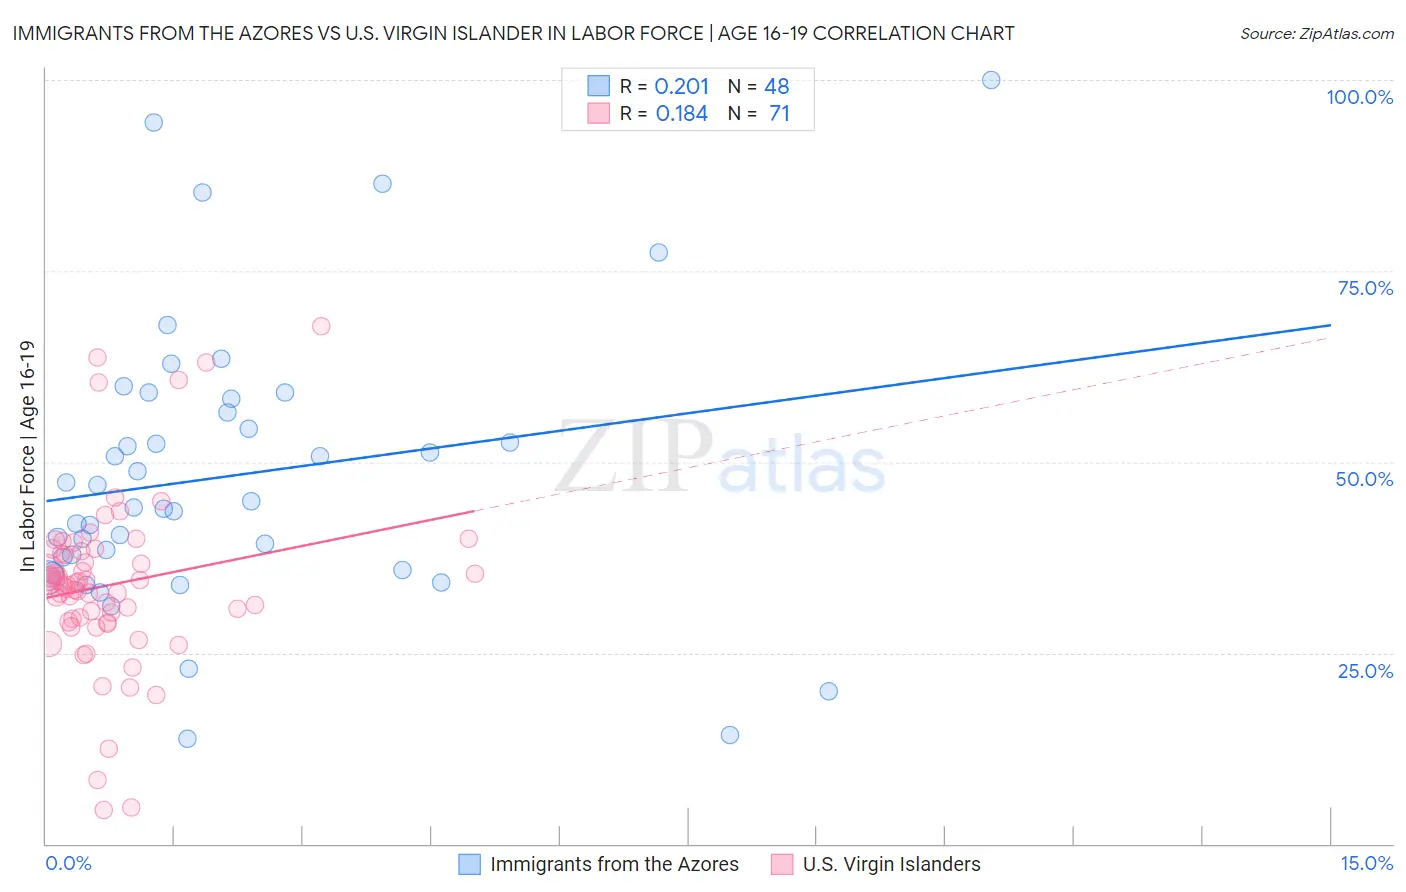
Immigrants from the Azores vs U.S. Virgin Islander In Labor Force | Age 16-19 Correlation Chart
The statistical analysis conducted on geographies consisting of 46,224,998 people shows a weak positive correlation between the proportion of Immigrants from the Azores and labor force participation rate among population between the ages 16 and 19 in the United States with a correlation coefficient (R) of 0.201 and weighted average of 41.7%. Similarly, the statistical analysis conducted on geographies consisting of 87,491,211 people shows a poor positive correlation between the proportion of U.S. Virgin Islanders and labor force participation rate among population between the ages 16 and 19 in the United States with a correlation coefficient (R) of 0.184 and weighted average of 33.6%, a difference of 24.1%.
In Labor Force | Age 16-19 Correlation Summary
| Measurement | Immigrants from the Azores | U.S. Virgin Islander |
| Minimum | 13.8% | 4.4% |
| Maximum | 100.0% | 67.8% |
| Range | 86.2% | 63.4% |
| Mean | 48.2% | 34.0% |
| Median | 44.4% | 33.9% |
| Interquartile 25% (IQ1) | 36.7% | 29.1% |
| Interquartile 75% (IQ3) | 57.4% | 38.3% |
| Interquartile Range (IQR) | 20.7% | 9.2% |
| Standard Deviation (Sample) | 18.5% | 11.4% |
| Standard Deviation (Population) | 18.3% | 11.4% |
Similar Demographics by In Labor Force | Age 16-19
Demographics Similar to Immigrants from the Azores by In Labor Force | Age 16-19
In terms of in labor force | age 16-19, the demographic groups most similar to Immigrants from the Azores are Immigrants from Congo (41.7%, a difference of 0.080%), Yugoslavian (41.8%, a difference of 0.14%), Immigrants from Bosnia and Herzegovina (41.8%, a difference of 0.16%), Liberian (41.8%, a difference of 0.24%), and Czechoslovakian (41.9%, a difference of 0.38%).
| Demographics | Rating | Rank | In Labor Force | Age 16-19 |
| French | 100.0 /100 | #29 | Exceptional 42.1% |
| Scottish | 100.0 /100 | #30 | Exceptional 42.0% |
| Irish | 100.0 /100 | #31 | Exceptional 42.0% |
| Czechoslovakians | 100.0 /100 | #32 | Exceptional 41.9% |
| Liberians | 100.0 /100 | #33 | Exceptional 41.8% |
| Immigrants | Bosnia and Herzegovina | 100.0 /100 | #34 | Exceptional 41.8% |
| Yugoslavians | 100.0 /100 | #35 | Exceptional 41.8% |
| Immigrants | Azores | 100.0 /100 | #36 | Exceptional 41.7% |
| Immigrants | Congo | 100.0 /100 | #37 | Exceptional 41.7% |
| Sioux | 100.0 /100 | #38 | Exceptional 41.5% |
| Scotch-Irish | 100.0 /100 | #39 | Exceptional 41.5% |
| Immigrants | Liberia | 100.0 /100 | #40 | Exceptional 41.5% |
| Celtics | 100.0 /100 | #41 | Exceptional 41.3% |
| Whites/Caucasians | 100.0 /100 | #42 | Exceptional 41.3% |
| Tongans | 100.0 /100 | #43 | Exceptional 41.2% |
Demographics Similar to U.S. Virgin Islanders by In Labor Force | Age 16-19
In terms of in labor force | age 16-19, the demographic groups most similar to U.S. Virgin Islanders are South American (33.6%, a difference of 0.080%), Immigrants from Spain (33.7%, a difference of 0.19%), Immigrants from Venezuela (33.7%, a difference of 0.25%), Nepalese (33.5%, a difference of 0.31%), and Immigrants from Indonesia (33.5%, a difference of 0.35%).
| Demographics | Rating | Rank | In Labor Force | Age 16-19 |
| Colombians | 0.3 /100 | #278 | Tragic 33.8% |
| Paraguayans | 0.3 /100 | #279 | Tragic 33.8% |
| Taiwanese | 0.3 /100 | #280 | Tragic 33.8% |
| Cypriots | 0.3 /100 | #281 | Tragic 33.8% |
| Immigrants | Korea | 0.3 /100 | #282 | Tragic 33.8% |
| Immigrants | Venezuela | 0.2 /100 | #283 | Tragic 33.7% |
| Immigrants | Spain | 0.2 /100 | #284 | Tragic 33.7% |
| U.S. Virgin Islanders | 0.2 /100 | #285 | Tragic 33.6% |
| South Americans | 0.2 /100 | #286 | Tragic 33.6% |
| Nepalese | 0.1 /100 | #287 | Tragic 33.5% |
| Immigrants | Indonesia | 0.1 /100 | #288 | Tragic 33.5% |
| Immigrants | Singapore | 0.1 /100 | #289 | Tragic 33.5% |
| Immigrants | Colombia | 0.1 /100 | #290 | Tragic 33.5% |
| Immigrants | Belarus | 0.1 /100 | #291 | Tragic 33.4% |
| Haitians | 0.1 /100 | #292 | Tragic 33.4% |