Yuman vs U.S. Virgin Islander In Labor Force | Age 16-19
COMPARE
Yuman
U.S. Virgin Islander
In Labor Force | Age 16-19
In Labor Force | Age 16-19 Comparison
Yuman
U.S. Virgin Islanders
27.7%
IN LABOR FORCE | AGE 16-19
0.0/ 100
METRIC RATING
343rd/ 347
METRIC RANK
33.6%
IN LABOR FORCE | AGE 16-19
0.2/ 100
METRIC RATING
285th/ 347
METRIC RANK
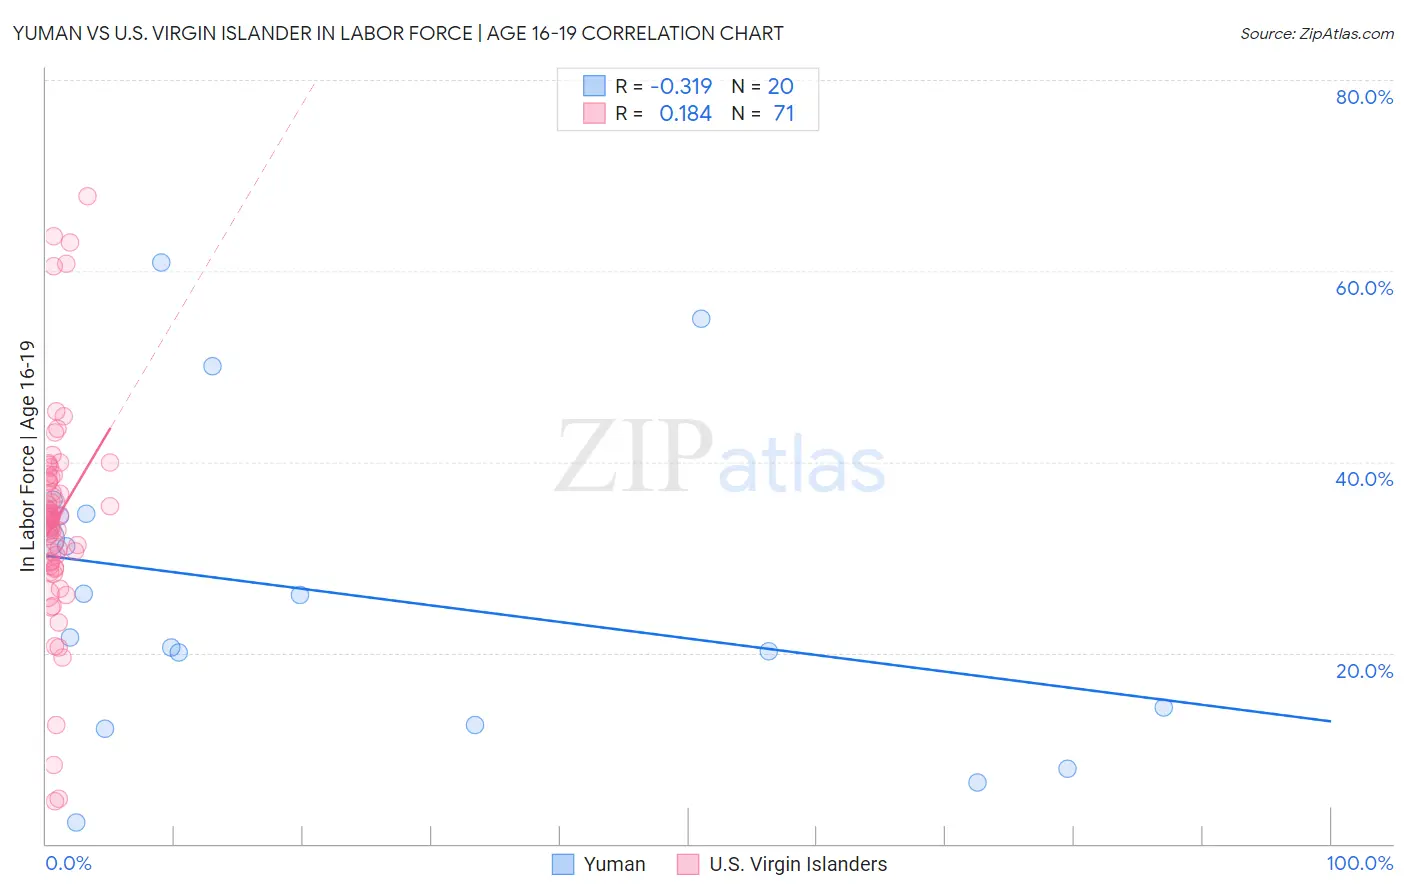
Yuman vs U.S. Virgin Islander In Labor Force | Age 16-19 Correlation Chart
The statistical analysis conducted on geographies consisting of 40,663,980 people shows a mild negative correlation between the proportion of Yuman and labor force participation rate among population between the ages 16 and 19 in the United States with a correlation coefficient (R) of -0.319 and weighted average of 27.7%. Similarly, the statistical analysis conducted on geographies consisting of 87,491,211 people shows a poor positive correlation between the proportion of U.S. Virgin Islanders and labor force participation rate among population between the ages 16 and 19 in the United States with a correlation coefficient (R) of 0.184 and weighted average of 33.6%, a difference of 21.6%.
In Labor Force | Age 16-19 Correlation Summary
| Measurement | Yuman | U.S. Virgin Islander |
| Minimum | 2.2% | 4.4% |
| Maximum | 60.9% | 67.8% |
| Range | 58.7% | 63.4% |
| Mean | 26.2% | 34.0% |
| Median | 23.8% | 33.9% |
| Interquartile 25% (IQ1) | 13.4% | 29.1% |
| Interquartile 75% (IQ3) | 34.5% | 38.3% |
| Interquartile Range (IQR) | 21.1% | 9.2% |
| Standard Deviation (Sample) | 16.0% | 11.4% |
| Standard Deviation (Population) | 15.6% | 11.4% |
Similar Demographics by In Labor Force | Age 16-19
Demographics Similar to Yuman by In Labor Force | Age 16-19
In terms of in labor force | age 16-19, the demographic groups most similar to Yuman are Guyanese (27.4%, a difference of 0.76%), Immigrants from Guyana (27.3%, a difference of 1.4%), Immigrants from Barbados (29.0%, a difference of 4.8%), Immigrants from Armenia (29.0%, a difference of 5.0%), and British West Indian (29.1%, a difference of 5.2%).
| Demographics | Rating | Rank | In Labor Force | Age 16-19 |
| Immigrants | Hong Kong | 0.0 /100 | #333 | Tragic 30.5% |
| Puerto Ricans | 0.0 /100 | #334 | Tragic 30.3% |
| Immigrants | Cuba | 0.0 /100 | #335 | Tragic 30.2% |
| Immigrants | Trinidad and Tobago | 0.0 /100 | #336 | Tragic 30.2% |
| Immigrants | Bangladesh | 0.0 /100 | #337 | Tragic 30.0% |
| Vietnamese | 0.0 /100 | #338 | Tragic 29.6% |
| Immigrants | Uzbekistan | 0.0 /100 | #339 | Tragic 29.2% |
| British West Indians | 0.0 /100 | #340 | Tragic 29.1% |
| Immigrants | Armenia | 0.0 /100 | #341 | Tragic 29.0% |
| Immigrants | Barbados | 0.0 /100 | #342 | Tragic 29.0% |
| Yuman | 0.0 /100 | #343 | Tragic 27.7% |
| Guyanese | 0.0 /100 | #344 | Tragic 27.4% |
| Immigrants | Guyana | 0.0 /100 | #345 | Tragic 27.3% |
| Immigrants | St. Vincent and the Grenadines | 0.0 /100 | #346 | Tragic 26.3% |
| Immigrants | Grenada | 0.0 /100 | #347 | Tragic 25.4% |
Demographics Similar to U.S. Virgin Islanders by In Labor Force | Age 16-19
In terms of in labor force | age 16-19, the demographic groups most similar to U.S. Virgin Islanders are South American (33.6%, a difference of 0.080%), Immigrants from Spain (33.7%, a difference of 0.19%), Immigrants from Venezuela (33.7%, a difference of 0.25%), Nepalese (33.5%, a difference of 0.31%), and Immigrants from Indonesia (33.5%, a difference of 0.35%).
| Demographics | Rating | Rank | In Labor Force | Age 16-19 |
| Colombians | 0.3 /100 | #278 | Tragic 33.8% |
| Paraguayans | 0.3 /100 | #279 | Tragic 33.8% |
| Taiwanese | 0.3 /100 | #280 | Tragic 33.8% |
| Cypriots | 0.3 /100 | #281 | Tragic 33.8% |
| Immigrants | Korea | 0.3 /100 | #282 | Tragic 33.8% |
| Immigrants | Venezuela | 0.2 /100 | #283 | Tragic 33.7% |
| Immigrants | Spain | 0.2 /100 | #284 | Tragic 33.7% |
| U.S. Virgin Islanders | 0.2 /100 | #285 | Tragic 33.6% |
| South Americans | 0.2 /100 | #286 | Tragic 33.6% |
| Nepalese | 0.1 /100 | #287 | Tragic 33.5% |
| Immigrants | Indonesia | 0.1 /100 | #288 | Tragic 33.5% |
| Immigrants | Singapore | 0.1 /100 | #289 | Tragic 33.5% |
| Immigrants | Colombia | 0.1 /100 | #290 | Tragic 33.5% |
| Immigrants | Belarus | 0.1 /100 | #291 | Tragic 33.4% |
| Haitians | 0.1 /100 | #292 | Tragic 33.4% |