Samoan vs Seminole In Labor Force | Age 16-19
COMPARE
Samoan
Seminole
In Labor Force | Age 16-19
In Labor Force | Age 16-19 Comparison
Samoans
Seminole
39.1%
IN LABOR FORCE | AGE 16-19
99.6/ 100
METRIC RATING
86th/ 347
METRIC RANK
38.1%
IN LABOR FORCE | AGE 16-19
96.7/ 100
METRIC RATING
123rd/ 347
METRIC RANK
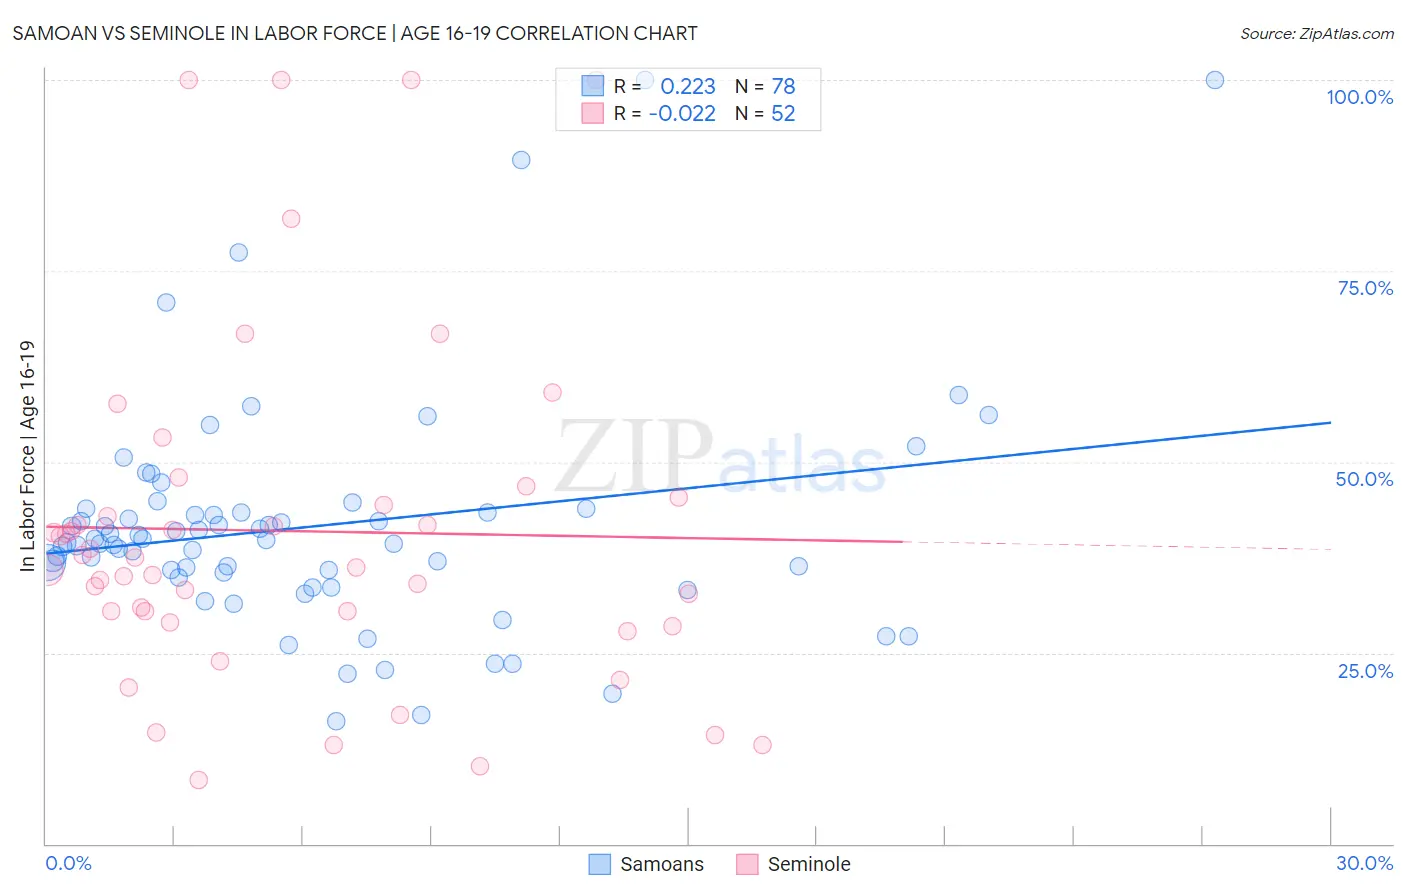
Samoan vs Seminole In Labor Force | Age 16-19 Correlation Chart
The statistical analysis conducted on geographies consisting of 225,011,822 people shows a weak positive correlation between the proportion of Samoans and labor force participation rate among population between the ages 16 and 19 in the United States with a correlation coefficient (R) of 0.223 and weighted average of 39.1%. Similarly, the statistical analysis conducted on geographies consisting of 118,237,632 people shows no correlation between the proportion of Seminole and labor force participation rate among population between the ages 16 and 19 in the United States with a correlation coefficient (R) of -0.022 and weighted average of 38.1%, a difference of 2.7%.
In Labor Force | Age 16-19 Correlation Summary
| Measurement | Samoan | Seminole |
| Minimum | 16.0% | 8.4% |
| Maximum | 100.0% | 100.0% |
| Range | 84.0% | 91.6% |
| Mean | 41.6% | 40.9% |
| Median | 39.5% | 36.8% |
| Interquartile 25% (IQ1) | 35.5% | 29.7% |
| Interquartile 75% (IQ3) | 43.3% | 44.9% |
| Interquartile Range (IQR) | 7.9% | 15.2% |
| Standard Deviation (Sample) | 15.2% | 22.5% |
| Standard Deviation (Population) | 15.1% | 22.3% |
Similar Demographics by In Labor Force | Age 16-19
Demographics Similar to Samoans by In Labor Force | Age 16-19
In terms of in labor force | age 16-19, the demographic groups most similar to Samoans are Creek (39.1%, a difference of 0.020%), Immigrants from Germany (39.1%, a difference of 0.080%), Puget Sound Salish (39.1%, a difference of 0.16%), Alaska Native (39.1%, a difference of 0.16%), and Immigrants from Uganda (39.2%, a difference of 0.17%).
| Demographics | Rating | Rank | In Labor Force | Age 16-19 |
| Marshallese | 99.8 /100 | #79 | Exceptional 39.5% |
| Immigrants | Iraq | 99.8 /100 | #80 | Exceptional 39.4% |
| Shoshone | 99.7 /100 | #81 | Exceptional 39.3% |
| Basques | 99.7 /100 | #82 | Exceptional 39.3% |
| Spanish | 99.7 /100 | #83 | Exceptional 39.3% |
| Immigrants | Uganda | 99.7 /100 | #84 | Exceptional 39.2% |
| Creek | 99.6 /100 | #85 | Exceptional 39.1% |
| Samoans | 99.6 /100 | #86 | Exceptional 39.1% |
| Immigrants | Germany | 99.6 /100 | #87 | Exceptional 39.1% |
| Puget Sound Salish | 99.6 /100 | #88 | Exceptional 39.1% |
| Alaska Natives | 99.6 /100 | #89 | Exceptional 39.1% |
| Immigrants | Burma/Myanmar | 99.5 /100 | #90 | Exceptional 39.0% |
| Spanish Americans | 99.5 /100 | #91 | Exceptional 39.0% |
| Osage | 99.4 /100 | #92 | Exceptional 39.0% |
| Blackfeet | 99.4 /100 | #93 | Exceptional 38.9% |
Demographics Similar to Seminole by In Labor Force | Age 16-19
In terms of in labor force | age 16-19, the demographic groups most similar to Seminole are Immigrants from England (38.1%, a difference of 0.080%), Immigrants from Africa (38.0%, a difference of 0.19%), Guamanian/Chamorro (38.2%, a difference of 0.30%), Ethiopian (38.2%, a difference of 0.32%), and African (38.0%, a difference of 0.34%).
| Demographics | Rating | Rank | In Labor Force | Age 16-19 |
| Colville | 97.9 /100 | #116 | Exceptional 38.3% |
| Chickasaw | 97.8 /100 | #117 | Exceptional 38.3% |
| Immigrants | Nepal | 97.8 /100 | #118 | Exceptional 38.3% |
| Assyrians/Chaldeans/Syriacs | 97.8 /100 | #119 | Exceptional 38.3% |
| Ukrainians | 97.6 /100 | #120 | Exceptional 38.3% |
| Ethiopians | 97.4 /100 | #121 | Exceptional 38.2% |
| Guamanians/Chamorros | 97.4 /100 | #122 | Exceptional 38.2% |
| Seminole | 96.7 /100 | #123 | Exceptional 38.1% |
| Immigrants | England | 96.4 /100 | #124 | Exceptional 38.1% |
| Immigrants | Africa | 96.1 /100 | #125 | Exceptional 38.0% |
| Africans | 95.6 /100 | #126 | Exceptional 38.0% |
| Choctaw | 95.6 /100 | #127 | Exceptional 38.0% |
| New Zealanders | 95.6 /100 | #128 | Exceptional 38.0% |
| Spaniards | 95.5 /100 | #129 | Exceptional 38.0% |
| Immigrants | Zimbabwe | 95.4 /100 | #130 | Exceptional 38.0% |