Immigrants from Australia vs Czech In Labor Force | Age 16-19
COMPARE
Immigrants from Australia
Czech
In Labor Force | Age 16-19
In Labor Force | Age 16-19 Comparison
Immigrants from Australia
Czechs
35.1%
IN LABOR FORCE | AGE 16-19
3.6/ 100
METRIC RATING
236th/ 347
METRIC RANK
43.6%
IN LABOR FORCE | AGE 16-19
100.0/ 100
METRIC RATING
16th/ 347
METRIC RANK
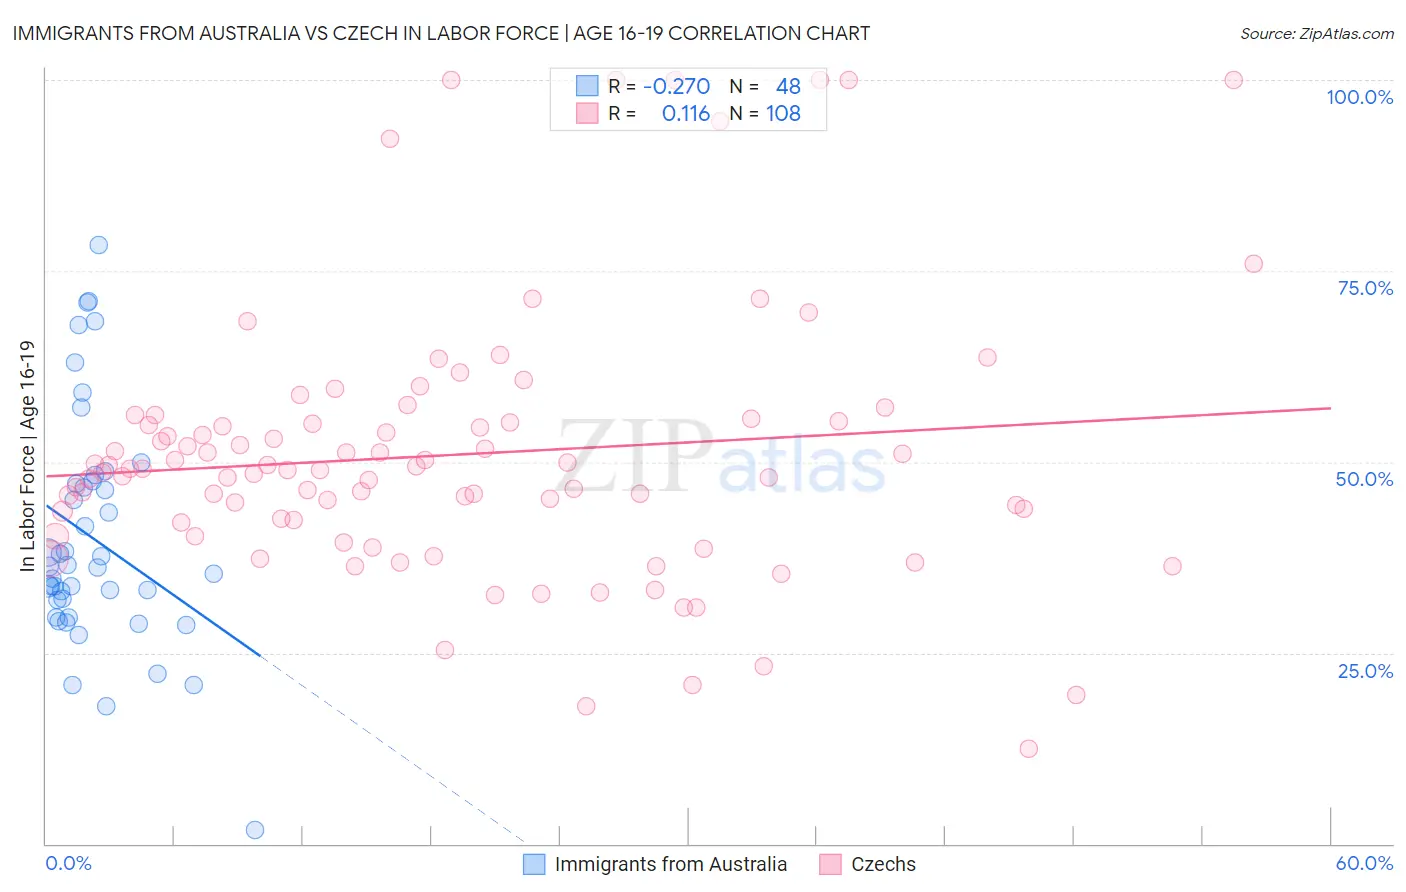
Immigrants from Australia vs Czech In Labor Force | Age 16-19 Correlation Chart
The statistical analysis conducted on geographies consisting of 226,866,182 people shows a weak negative correlation between the proportion of Immigrants from Australia and labor force participation rate among population between the ages 16 and 19 in the United States with a correlation coefficient (R) of -0.270 and weighted average of 35.1%. Similarly, the statistical analysis conducted on geographies consisting of 483,278,851 people shows a poor positive correlation between the proportion of Czechs and labor force participation rate among population between the ages 16 and 19 in the United States with a correlation coefficient (R) of 0.116 and weighted average of 43.6%, a difference of 24.5%.
In Labor Force | Age 16-19 Correlation Summary
| Measurement | Immigrants from Australia | Czech |
| Minimum | 1.8% | 12.5% |
| Maximum | 78.4% | 100.0% |
| Range | 76.6% | 87.5% |
| Mean | 39.9% | 50.9% |
| Median | 36.2% | 49.1% |
| Interquartile 25% (IQ1) | 30.8% | 42.3% |
| Interquartile 75% (IQ3) | 47.3% | 55.2% |
| Interquartile Range (IQR) | 16.5% | 13.0% |
| Standard Deviation (Sample) | 15.3% | 17.5% |
| Standard Deviation (Population) | 15.2% | 17.4% |
Similar Demographics by In Labor Force | Age 16-19
Demographics Similar to Immigrants from Australia by In Labor Force | Age 16-19
In terms of in labor force | age 16-19, the demographic groups most similar to Immigrants from Australia are Immigrants from India (35.0%, a difference of 0.030%), Immigrants from Vietnam (35.0%, a difference of 0.070%), Immigrants from Philippines (35.1%, a difference of 0.14%), Inupiat (35.0%, a difference of 0.16%), and Immigrants from Mexico (35.1%, a difference of 0.22%).
| Demographics | Rating | Rank | In Labor Force | Age 16-19 |
| Immigrants | Lebanon | 5.0 /100 | #229 | Tragic 35.2% |
| Immigrants | Honduras | 4.9 /100 | #230 | Tragic 35.2% |
| Immigrants | Syria | 4.5 /100 | #231 | Tragic 35.2% |
| Immigrants | Kazakhstan | 4.5 /100 | #232 | Tragic 35.2% |
| Immigrants | France | 4.3 /100 | #233 | Tragic 35.1% |
| Immigrants | Mexico | 4.2 /100 | #234 | Tragic 35.1% |
| Immigrants | Philippines | 4.0 /100 | #235 | Tragic 35.1% |
| Immigrants | Australia | 3.6 /100 | #236 | Tragic 35.1% |
| Immigrants | India | 3.5 /100 | #237 | Tragic 35.0% |
| Immigrants | Vietnam | 3.4 /100 | #238 | Tragic 35.0% |
| Inupiat | 3.2 /100 | #239 | Tragic 35.0% |
| Immigrants | Central America | 3.0 /100 | #240 | Tragic 35.0% |
| Immigrants | Ireland | 2.9 /100 | #241 | Tragic 35.0% |
| Uruguayans | 2.6 /100 | #242 | Tragic 34.9% |
| Pueblo | 2.6 /100 | #243 | Tragic 34.9% |
Demographics Similar to Czechs by In Labor Force | Age 16-19
In terms of in labor force | age 16-19, the demographic groups most similar to Czechs are Scandinavian (43.6%, a difference of 0.070%), Slovene (43.7%, a difference of 0.11%), French Canadian (43.6%, a difference of 0.14%), Chippewa (43.8%, a difference of 0.36%), and Dutch (43.8%, a difference of 0.47%).
| Demographics | Rating | Rank | In Labor Force | Age 16-19 |
| Cape Verdeans | 100.0 /100 | #9 | Exceptional 44.5% |
| Germans | 100.0 /100 | #10 | Exceptional 44.2% |
| Swedes | 100.0 /100 | #11 | Exceptional 44.1% |
| Finns | 100.0 /100 | #12 | Exceptional 43.9% |
| Dutch | 100.0 /100 | #13 | Exceptional 43.8% |
| Chippewa | 100.0 /100 | #14 | Exceptional 43.8% |
| Slovenes | 100.0 /100 | #15 | Exceptional 43.7% |
| Czechs | 100.0 /100 | #16 | Exceptional 43.6% |
| Scandinavians | 100.0 /100 | #17 | Exceptional 43.6% |
| French Canadians | 100.0 /100 | #18 | Exceptional 43.6% |
| Belgians | 100.0 /100 | #19 | Exceptional 43.4% |
| Swiss | 100.0 /100 | #20 | Exceptional 43.3% |
| Ottawa | 100.0 /100 | #21 | Exceptional 43.0% |
| Sudanese | 100.0 /100 | #22 | Exceptional 42.9% |
| Slovaks | 100.0 /100 | #23 | Exceptional 42.6% |