Immigrants from Italy vs Czech In Labor Force | Age 16-19
COMPARE
Immigrants from Italy
Czech
In Labor Force | Age 16-19
In Labor Force | Age 16-19 Comparison
Immigrants from Italy
Czechs
36.4%
IN LABOR FORCE | AGE 16-19
39.1/ 100
METRIC RATING
182nd/ 347
METRIC RANK
43.6%
IN LABOR FORCE | AGE 16-19
100.0/ 100
METRIC RATING
16th/ 347
METRIC RANK
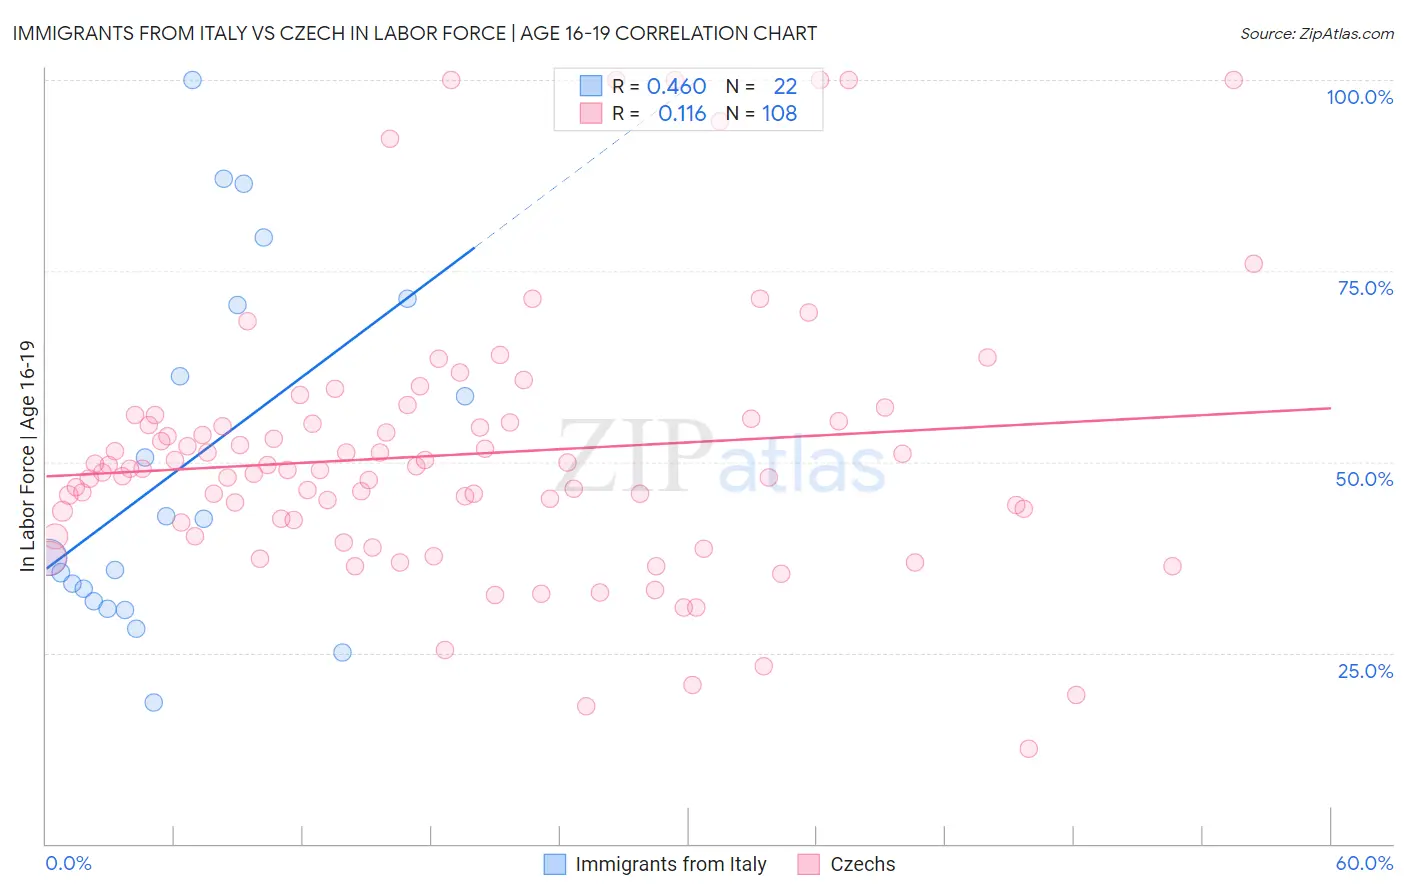
Immigrants from Italy vs Czech In Labor Force | Age 16-19 Correlation Chart
The statistical analysis conducted on geographies consisting of 323,614,994 people shows a moderate positive correlation between the proportion of Immigrants from Italy and labor force participation rate among population between the ages 16 and 19 in the United States with a correlation coefficient (R) of 0.460 and weighted average of 36.4%. Similarly, the statistical analysis conducted on geographies consisting of 483,278,851 people shows a poor positive correlation between the proportion of Czechs and labor force participation rate among population between the ages 16 and 19 in the United States with a correlation coefficient (R) of 0.116 and weighted average of 43.6%, a difference of 20.0%.
In Labor Force | Age 16-19 Correlation Summary
| Measurement | Immigrants from Italy | Czech |
| Minimum | 18.4% | 12.5% |
| Maximum | 100.0% | 100.0% |
| Range | 81.6% | 87.5% |
| Mean | 49.6% | 50.9% |
| Median | 40.0% | 49.1% |
| Interquartile 25% (IQ1) | 31.8% | 42.3% |
| Interquartile 75% (IQ3) | 70.6% | 55.2% |
| Interquartile Range (IQR) | 38.8% | 13.0% |
| Standard Deviation (Sample) | 23.4% | 17.5% |
| Standard Deviation (Population) | 22.9% | 17.4% |
Similar Demographics by In Labor Force | Age 16-19
Demographics Similar to Immigrants from Italy by In Labor Force | Age 16-19
In terms of in labor force | age 16-19, the demographic groups most similar to Immigrants from Italy are Eastern European (36.4%, a difference of 0.020%), Jordanian (36.4%, a difference of 0.030%), Immigrants from Morocco (36.4%, a difference of 0.10%), Costa Rican (36.3%, a difference of 0.16%), and Bhutanese (36.3%, a difference of 0.21%).
| Demographics | Rating | Rank | In Labor Force | Age 16-19 |
| Natives/Alaskans | 49.0 /100 | #175 | Average 36.6% |
| Albanians | 48.8 /100 | #176 | Average 36.5% |
| Immigrants | Northern Europe | 46.6 /100 | #177 | Average 36.5% |
| Blacks/African Americans | 45.1 /100 | #178 | Average 36.5% |
| Immigrants | Southern Europe | 43.3 /100 | #179 | Average 36.4% |
| Immigrants | Morocco | 41.1 /100 | #180 | Average 36.4% |
| Jordanians | 39.6 /100 | #181 | Fair 36.4% |
| Immigrants | Italy | 39.1 /100 | #182 | Fair 36.4% |
| Eastern Europeans | 38.8 /100 | #183 | Fair 36.4% |
| Costa Ricans | 36.1 /100 | #184 | Fair 36.3% |
| Bhutanese | 35.3 /100 | #185 | Fair 36.3% |
| Immigrants | Romania | 34.0 /100 | #186 | Fair 36.3% |
| Immigrants | Afghanistan | 34.0 /100 | #187 | Fair 36.3% |
| Immigrants | Europe | 31.8 /100 | #188 | Fair 36.2% |
| Immigrants | Hungary | 28.8 /100 | #189 | Fair 36.2% |
Demographics Similar to Czechs by In Labor Force | Age 16-19
In terms of in labor force | age 16-19, the demographic groups most similar to Czechs are Scandinavian (43.6%, a difference of 0.070%), Slovene (43.7%, a difference of 0.11%), French Canadian (43.6%, a difference of 0.14%), Chippewa (43.8%, a difference of 0.36%), and Dutch (43.8%, a difference of 0.47%).
| Demographics | Rating | Rank | In Labor Force | Age 16-19 |
| Cape Verdeans | 100.0 /100 | #9 | Exceptional 44.5% |
| Germans | 100.0 /100 | #10 | Exceptional 44.2% |
| Swedes | 100.0 /100 | #11 | Exceptional 44.1% |
| Finns | 100.0 /100 | #12 | Exceptional 43.9% |
| Dutch | 100.0 /100 | #13 | Exceptional 43.8% |
| Chippewa | 100.0 /100 | #14 | Exceptional 43.8% |
| Slovenes | 100.0 /100 | #15 | Exceptional 43.7% |
| Czechs | 100.0 /100 | #16 | Exceptional 43.6% |
| Scandinavians | 100.0 /100 | #17 | Exceptional 43.6% |
| French Canadians | 100.0 /100 | #18 | Exceptional 43.6% |
| Belgians | 100.0 /100 | #19 | Exceptional 43.4% |
| Swiss | 100.0 /100 | #20 | Exceptional 43.3% |
| Ottawa | 100.0 /100 | #21 | Exceptional 43.0% |
| Sudanese | 100.0 /100 | #22 | Exceptional 42.9% |
| Slovaks | 100.0 /100 | #23 | Exceptional 42.6% |