Serbian vs Czech In Labor Force | Age 16-19
COMPARE
Serbian
Czech
In Labor Force | Age 16-19
In Labor Force | Age 16-19 Comparison
Serbians
Czechs
39.9%
IN LABOR FORCE | AGE 16-19
99.9/ 100
METRIC RATING
71st/ 347
METRIC RANK
43.6%
IN LABOR FORCE | AGE 16-19
100.0/ 100
METRIC RATING
16th/ 347
METRIC RANK
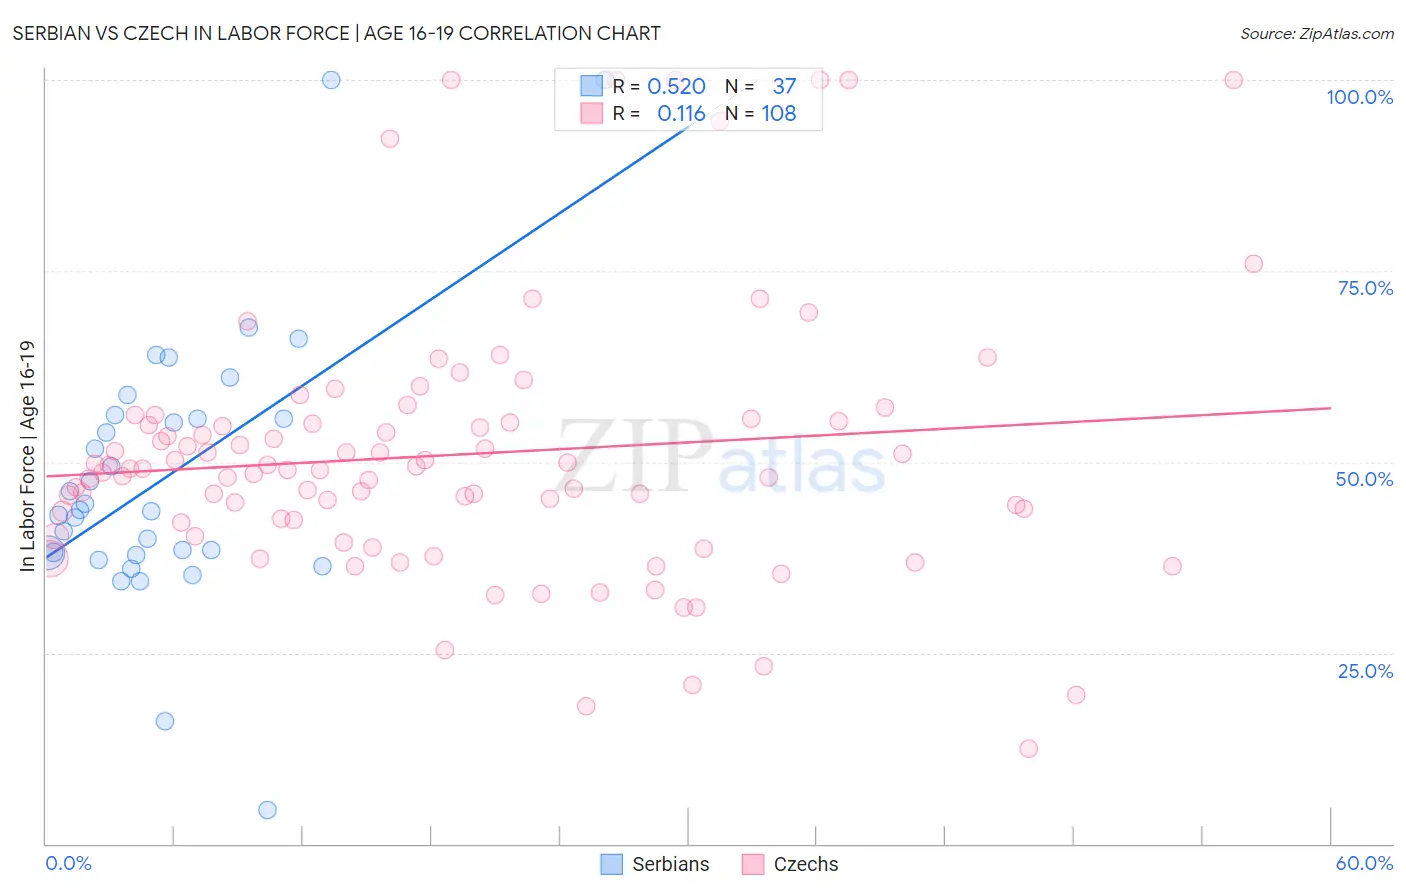
Serbian vs Czech In Labor Force | Age 16-19 Correlation Chart
The statistical analysis conducted on geographies consisting of 267,337,384 people shows a substantial positive correlation between the proportion of Serbians and labor force participation rate among population between the ages 16 and 19 in the United States with a correlation coefficient (R) of 0.520 and weighted average of 39.9%. Similarly, the statistical analysis conducted on geographies consisting of 483,278,851 people shows a poor positive correlation between the proportion of Czechs and labor force participation rate among population between the ages 16 and 19 in the United States with a correlation coefficient (R) of 0.116 and weighted average of 43.6%, a difference of 9.2%.
In Labor Force | Age 16-19 Correlation Summary
| Measurement | Serbian | Czech |
| Minimum | 4.4% | 12.5% |
| Maximum | 100.0% | 100.0% |
| Range | 95.6% | 87.5% |
| Mean | 48.0% | 50.9% |
| Median | 43.6% | 49.1% |
| Interquartile 25% (IQ1) | 37.9% | 42.3% |
| Interquartile 75% (IQ3) | 55.9% | 55.2% |
| Interquartile Range (IQR) | 18.0% | 13.0% |
| Standard Deviation (Sample) | 18.1% | 17.5% |
| Standard Deviation (Population) | 17.8% | 17.4% |
Similar Demographics by In Labor Force | Age 16-19
Demographics Similar to Serbians by In Labor Force | Age 16-19
In terms of in labor force | age 16-19, the demographic groups most similar to Serbians are Iroquois (39.9%, a difference of 0.010%), Immigrants from Middle Africa (39.9%, a difference of 0.040%), Portuguese (40.0%, a difference of 0.17%), Potawatomi (40.0%, a difference of 0.22%), and Hungarian (39.8%, a difference of 0.27%).
| Demographics | Rating | Rank | In Labor Force | Age 16-19 |
| Immigrants | Micronesia | 100.0 /100 | #64 | Exceptional 40.2% |
| Kenyans | 100.0 /100 | #65 | Exceptional 40.1% |
| Immigrants | Nonimmigrants | 100.0 /100 | #66 | Exceptional 40.1% |
| Canadians | 100.0 /100 | #67 | Exceptional 40.1% |
| Italians | 99.9 /100 | #68 | Exceptional 40.1% |
| Potawatomi | 99.9 /100 | #69 | Exceptional 40.0% |
| Portuguese | 99.9 /100 | #70 | Exceptional 40.0% |
| Serbians | 99.9 /100 | #71 | Exceptional 39.9% |
| Iroquois | 99.9 /100 | #72 | Exceptional 39.9% |
| Immigrants | Middle Africa | 99.9 /100 | #73 | Exceptional 39.9% |
| Hungarians | 99.9 /100 | #74 | Exceptional 39.8% |
| French American Indians | 99.9 /100 | #75 | Exceptional 39.8% |
| Malaysians | 99.9 /100 | #76 | Exceptional 39.7% |
| Immigrants | Portugal | 99.9 /100 | #77 | Exceptional 39.7% |
| Austrians | 99.8 /100 | #78 | Exceptional 39.5% |
Demographics Similar to Czechs by In Labor Force | Age 16-19
In terms of in labor force | age 16-19, the demographic groups most similar to Czechs are Scandinavian (43.6%, a difference of 0.070%), Slovene (43.7%, a difference of 0.11%), French Canadian (43.6%, a difference of 0.14%), Chippewa (43.8%, a difference of 0.36%), and Dutch (43.8%, a difference of 0.47%).
| Demographics | Rating | Rank | In Labor Force | Age 16-19 |
| Cape Verdeans | 100.0 /100 | #9 | Exceptional 44.5% |
| Germans | 100.0 /100 | #10 | Exceptional 44.2% |
| Swedes | 100.0 /100 | #11 | Exceptional 44.1% |
| Finns | 100.0 /100 | #12 | Exceptional 43.9% |
| Dutch | 100.0 /100 | #13 | Exceptional 43.8% |
| Chippewa | 100.0 /100 | #14 | Exceptional 43.8% |
| Slovenes | 100.0 /100 | #15 | Exceptional 43.7% |
| Czechs | 100.0 /100 | #16 | Exceptional 43.6% |
| Scandinavians | 100.0 /100 | #17 | Exceptional 43.6% |
| French Canadians | 100.0 /100 | #18 | Exceptional 43.6% |
| Belgians | 100.0 /100 | #19 | Exceptional 43.4% |
| Swiss | 100.0 /100 | #20 | Exceptional 43.3% |
| Ottawa | 100.0 /100 | #21 | Exceptional 43.0% |
| Sudanese | 100.0 /100 | #22 | Exceptional 42.9% |
| Slovaks | 100.0 /100 | #23 | Exceptional 42.6% |