Romanian vs Danish In Labor Force | Age 35-44
COMPARE
Romanian
Danish
In Labor Force | Age 35-44
In Labor Force | Age 35-44 Comparison
Romanians
Danes
84.5%
IN LABOR FORCE | AGE 35-44
72.1/ 100
METRIC RATING
151st/ 347
METRIC RANK
84.3%
IN LABOR FORCE | AGE 35-44
38.8/ 100
METRIC RATING
180th/ 347
METRIC RANK
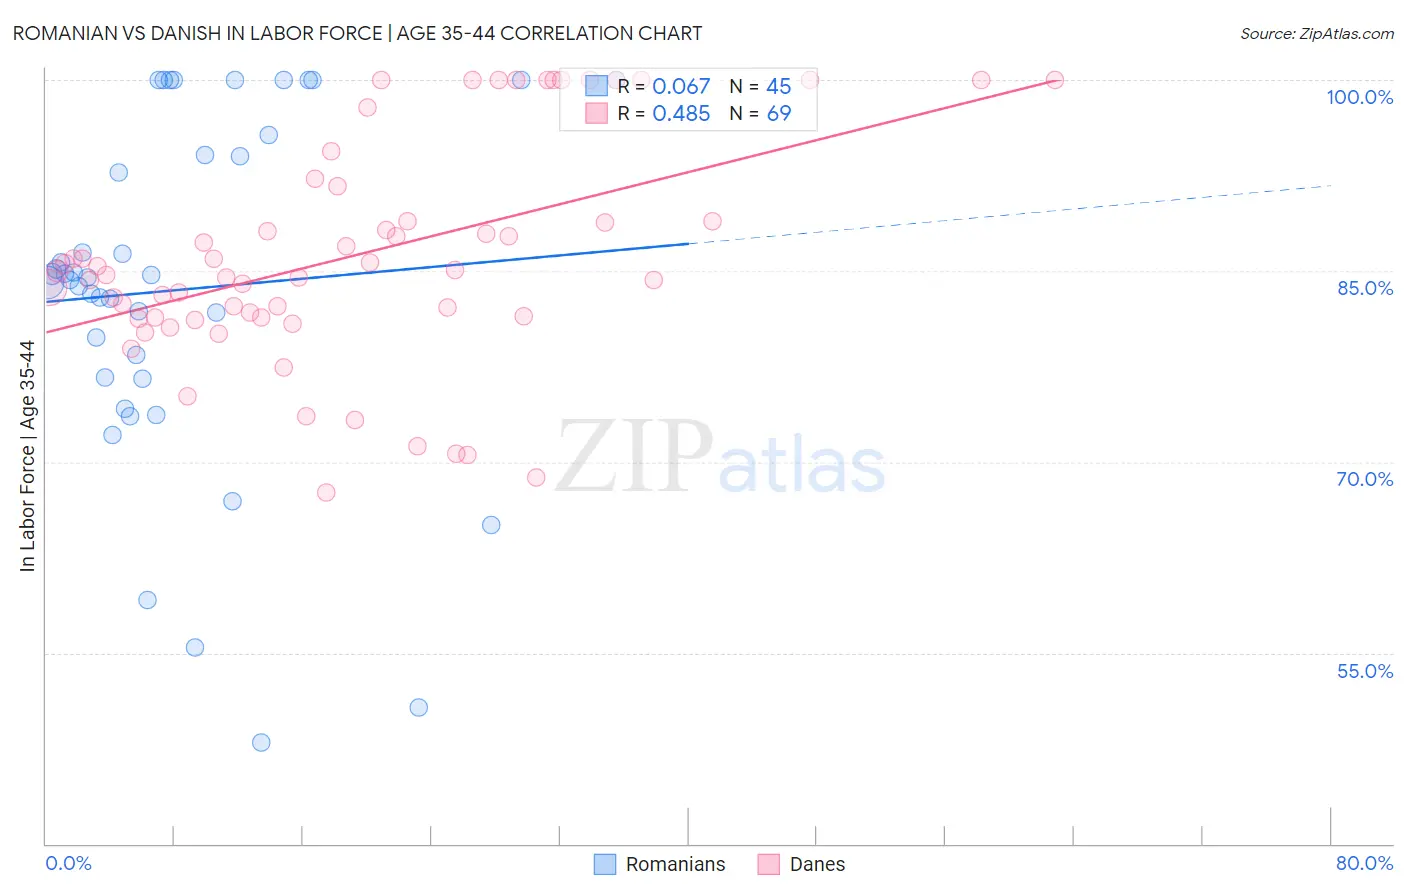
Romanian vs Danish In Labor Force | Age 35-44 Correlation Chart
The statistical analysis conducted on geographies consisting of 377,740,706 people shows a slight positive correlation between the proportion of Romanians and labor force participation rate among population between the ages 35 and 44 in the United States with a correlation coefficient (R) of 0.067 and weighted average of 84.5%. Similarly, the statistical analysis conducted on geographies consisting of 473,902,315 people shows a moderate positive correlation between the proportion of Danes and labor force participation rate among population between the ages 35 and 44 in the United States with a correlation coefficient (R) of 0.485 and weighted average of 84.3%, a difference of 0.23%.
In Labor Force | Age 35-44 Correlation Summary
| Measurement | Romanian | Danish |
| Minimum | 48.0% | 67.6% |
| Maximum | 100.0% | 100.0% |
| Range | 52.0% | 32.4% |
| Mean | 83.5% | 86.2% |
| Median | 84.5% | 85.0% |
| Interquartile 25% (IQ1) | 76.6% | 81.3% |
| Interquartile 75% (IQ3) | 94.9% | 90.3% |
| Interquartile Range (IQR) | 18.3% | 9.0% |
| Standard Deviation (Sample) | 13.6% | 8.7% |
| Standard Deviation (Population) | 13.4% | 8.6% |
Similar Demographics by In Labor Force | Age 35-44
Demographics Similar to Romanians by In Labor Force | Age 35-44
In terms of in labor force | age 35-44, the demographic groups most similar to Romanians are South American Indian (84.5%, a difference of 0.010%), Okinawan (84.5%, a difference of 0.010%), Immigrants from Nigeria (84.5%, a difference of 0.010%), Immigrants from Taiwan (84.5%, a difference of 0.010%), and Trinidadian and Tobagonian (84.5%, a difference of 0.020%).
| Demographics | Rating | Rank | In Labor Force | Age 35-44 |
| Immigrants | Jamaica | 79.4 /100 | #144 | Good 84.6% |
| Immigrants | Saudi Arabia | 79.4 /100 | #145 | Good 84.6% |
| Immigrants | Asia | 78.7 /100 | #146 | Good 84.5% |
| Immigrants | Netherlands | 76.6 /100 | #147 | Good 84.5% |
| South American Indians | 73.6 /100 | #148 | Good 84.5% |
| Okinawans | 73.5 /100 | #149 | Good 84.5% |
| Immigrants | Nigeria | 73.3 /100 | #150 | Good 84.5% |
| Romanians | 72.1 /100 | #151 | Good 84.5% |
| Immigrants | Taiwan | 71.4 /100 | #152 | Good 84.5% |
| Trinidadians and Tobagonians | 69.5 /100 | #153 | Good 84.5% |
| Iranians | 69.4 /100 | #154 | Good 84.5% |
| Immigrants | Switzerland | 65.9 /100 | #155 | Good 84.5% |
| Immigrants | Israel | 64.3 /100 | #156 | Good 84.4% |
| Immigrants | Austria | 63.8 /100 | #157 | Good 84.4% |
| Jamaicans | 62.7 /100 | #158 | Good 84.4% |
Demographics Similar to Danes by In Labor Force | Age 35-44
In terms of in labor force | age 35-44, the demographic groups most similar to Danes are Immigrants from West Indies (84.3%, a difference of 0.020%), Korean (84.3%, a difference of 0.020%), Barbadian (84.3%, a difference of 0.020%), Armenian (84.3%, a difference of 0.020%), and Costa Rican (84.3%, a difference of 0.020%).
| Demographics | Rating | Rank | In Labor Force | Age 35-44 |
| Immigrants | Trinidad and Tobago | 50.7 /100 | #173 | Average 84.4% |
| Immigrants | Iran | 50.0 /100 | #174 | Average 84.4% |
| Pakistanis | 48.2 /100 | #175 | Average 84.4% |
| Sri Lankans | 47.3 /100 | #176 | Average 84.4% |
| French Canadians | 44.3 /100 | #177 | Average 84.3% |
| Northern Europeans | 44.1 /100 | #178 | Average 84.3% |
| Immigrants | South Africa | 42.8 /100 | #179 | Average 84.3% |
| Danes | 38.8 /100 | #180 | Fair 84.3% |
| Immigrants | West Indies | 36.4 /100 | #181 | Fair 84.3% |
| Koreans | 36.3 /100 | #182 | Fair 84.3% |
| Barbadians | 36.2 /100 | #183 | Fair 84.3% |
| Armenians | 35.6 /100 | #184 | Fair 84.3% |
| Costa Ricans | 35.3 /100 | #185 | Fair 84.3% |
| Australians | 35.1 /100 | #186 | Fair 84.3% |
| Dutch | 34.8 /100 | #187 | Fair 84.3% |