Puget Sound Salish vs Norwegian In Labor Force | Age 20-24
COMPARE
Puget Sound Salish
Norwegian
In Labor Force | Age 20-24
In Labor Force | Age 20-24 Comparison
Puget Sound Salish
Norwegians
78.0%
IN LABOR FORCE | AGE 20-24
100.0/ 100
METRIC RATING
21st/ 347
METRIC RANK
80.1%
IN LABOR FORCE | AGE 20-24
100.0/ 100
METRIC RATING
1st/ 347
METRIC RANK
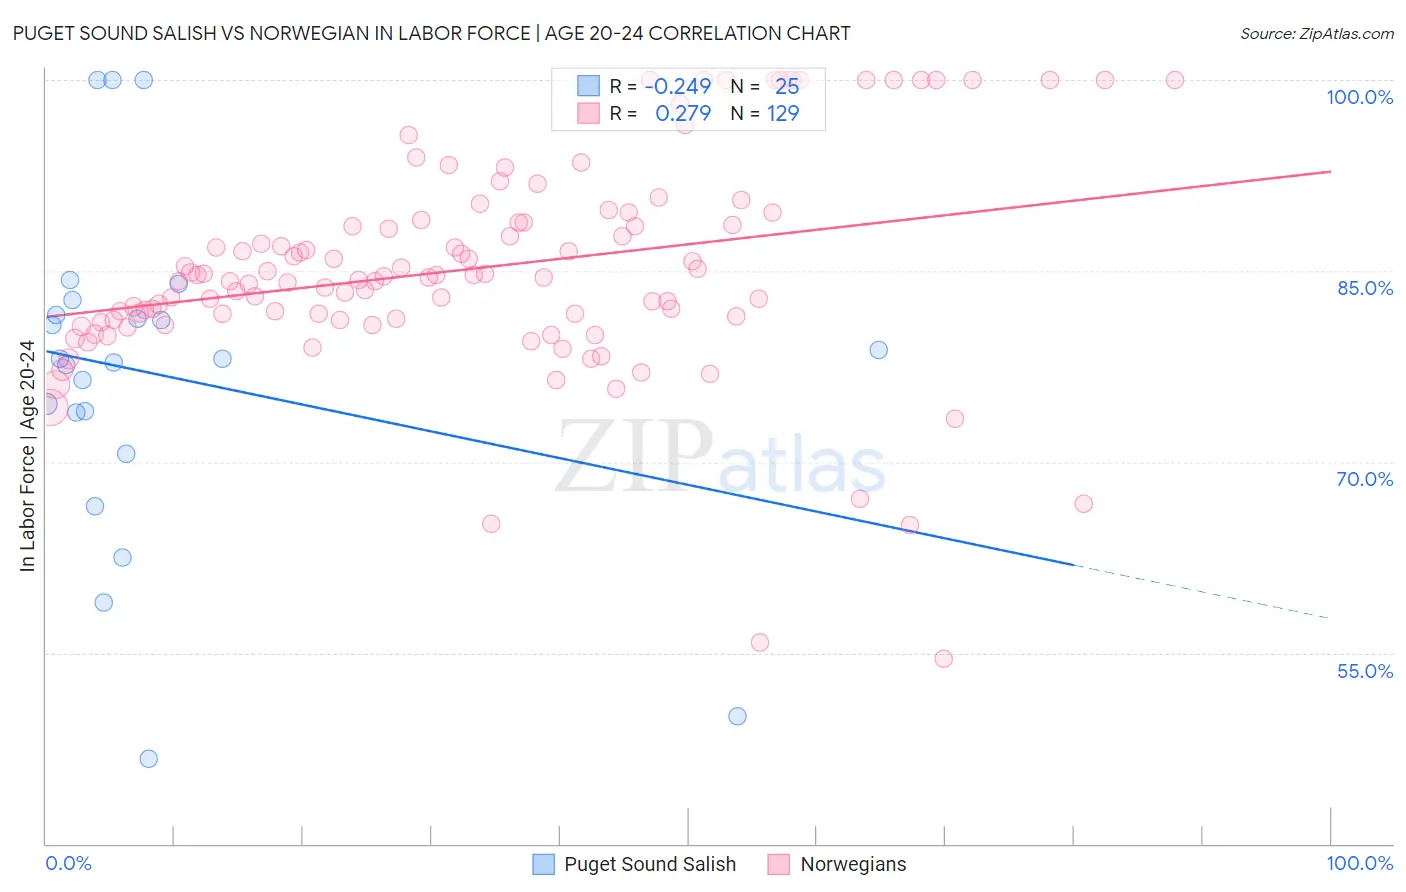
Puget Sound Salish vs Norwegian In Labor Force | Age 20-24 Correlation Chart
The statistical analysis conducted on geographies consisting of 46,155,398 people shows a weak negative correlation between the proportion of Puget Sound Salish and labor force participation rate among population between the ages 20 and 24 in the United States with a correlation coefficient (R) of -0.249 and weighted average of 78.0%. Similarly, the statistical analysis conducted on geographies consisting of 532,369,194 people shows a weak positive correlation between the proportion of Norwegians and labor force participation rate among population between the ages 20 and 24 in the United States with a correlation coefficient (R) of 0.279 and weighted average of 80.1%, a difference of 2.7%.
In Labor Force | Age 20-24 Correlation Summary
| Measurement | Puget Sound Salish | Norwegian |
| Minimum | 46.7% | 54.5% |
| Maximum | 100.0% | 100.0% |
| Range | 53.3% | 45.5% |
| Mean | 76.8% | 85.2% |
| Median | 78.1% | 84.5% |
| Interquartile 25% (IQ1) | 72.2% | 81.1% |
| Interquartile 75% (IQ3) | 82.1% | 88.9% |
| Interquartile Range (IQR) | 9.9% | 7.8% |
| Standard Deviation (Sample) | 13.2% | 8.5% |
| Standard Deviation (Population) | 12.9% | 8.5% |
Demographics Similar to Puget Sound Salish and Norwegians by In Labor Force | Age 20-24
In terms of in labor force | age 20-24, the demographic groups most similar to Puget Sound Salish are French Canadian (78.1%, a difference of 0.070%), Immigrants from Bosnia and Herzegovina (78.1%, a difference of 0.14%), Bangladeshi (78.1%, a difference of 0.14%), Cape Verdean (78.3%, a difference of 0.44%), and Dutch (78.4%, a difference of 0.48%). Similarly, the demographic groups most similar to Norwegians are Immigrants from Somalia (79.5%, a difference of 0.76%), Somali (79.3%, a difference of 1.1%), Alaskan Athabascan (79.1%, a difference of 1.3%), Aleut (79.0%, a difference of 1.5%), and Danish (79.0%, a difference of 1.5%).
| Demographics | Rating | Rank | In Labor Force | Age 20-24 |
| Norwegians | 100.0 /100 | #1 | Exceptional 80.1% |
| Immigrants | Somalia | 100.0 /100 | #2 | Exceptional 79.5% |
| Somalis | 100.0 /100 | #3 | Exceptional 79.3% |
| Alaskan Athabascans | 100.0 /100 | #4 | Exceptional 79.1% |
| Aleuts | 100.0 /100 | #5 | Exceptional 79.0% |
| Danes | 100.0 /100 | #6 | Exceptional 79.0% |
| Luxembourgers | 100.0 /100 | #7 | Exceptional 79.0% |
| Immigrants | Cabo Verde | 100.0 /100 | #8 | Exceptional 78.9% |
| Swedes | 100.0 /100 | #9 | Exceptional 78.8% |
| Slovenes | 100.0 /100 | #10 | Exceptional 78.7% |
| Finns | 100.0 /100 | #11 | Exceptional 78.7% |
| Germans | 100.0 /100 | #12 | Exceptional 78.6% |
| Scandinavians | 100.0 /100 | #13 | Exceptional 78.5% |
| Czechs | 100.0 /100 | #14 | Exceptional 78.5% |
| Sudanese | 100.0 /100 | #15 | Exceptional 78.4% |
| Dutch | 100.0 /100 | #16 | Exceptional 78.4% |
| Cape Verdeans | 100.0 /100 | #17 | Exceptional 78.3% |
| Immigrants | Bosnia and Herzegovina | 100.0 /100 | #18 | Exceptional 78.1% |
| Bangladeshis | 100.0 /100 | #19 | Exceptional 78.1% |
| French Canadians | 100.0 /100 | #20 | Exceptional 78.1% |
| Puget Sound Salish | 100.0 /100 | #21 | Exceptional 78.0% |