Puget Sound Salish vs Immigrants from Hungary Unemployment Among Ages 35 to 44 years
COMPARE
Puget Sound Salish
Immigrants from Hungary
Unemployment Among Ages 35 to 44 years
Unemployment Among Ages 35 to 44 years Comparison
Puget Sound Salish
Immigrants from Hungary
4.6%
UNEMPLOYMENT AMONG AGES 35 TO 44 YEARS
67.1/ 100
METRIC RATING
151st/ 347
METRIC RANK
4.6%
UNEMPLOYMENT AMONG AGES 35 TO 44 YEARS
76.3/ 100
METRIC RATING
139th/ 347
METRIC RANK
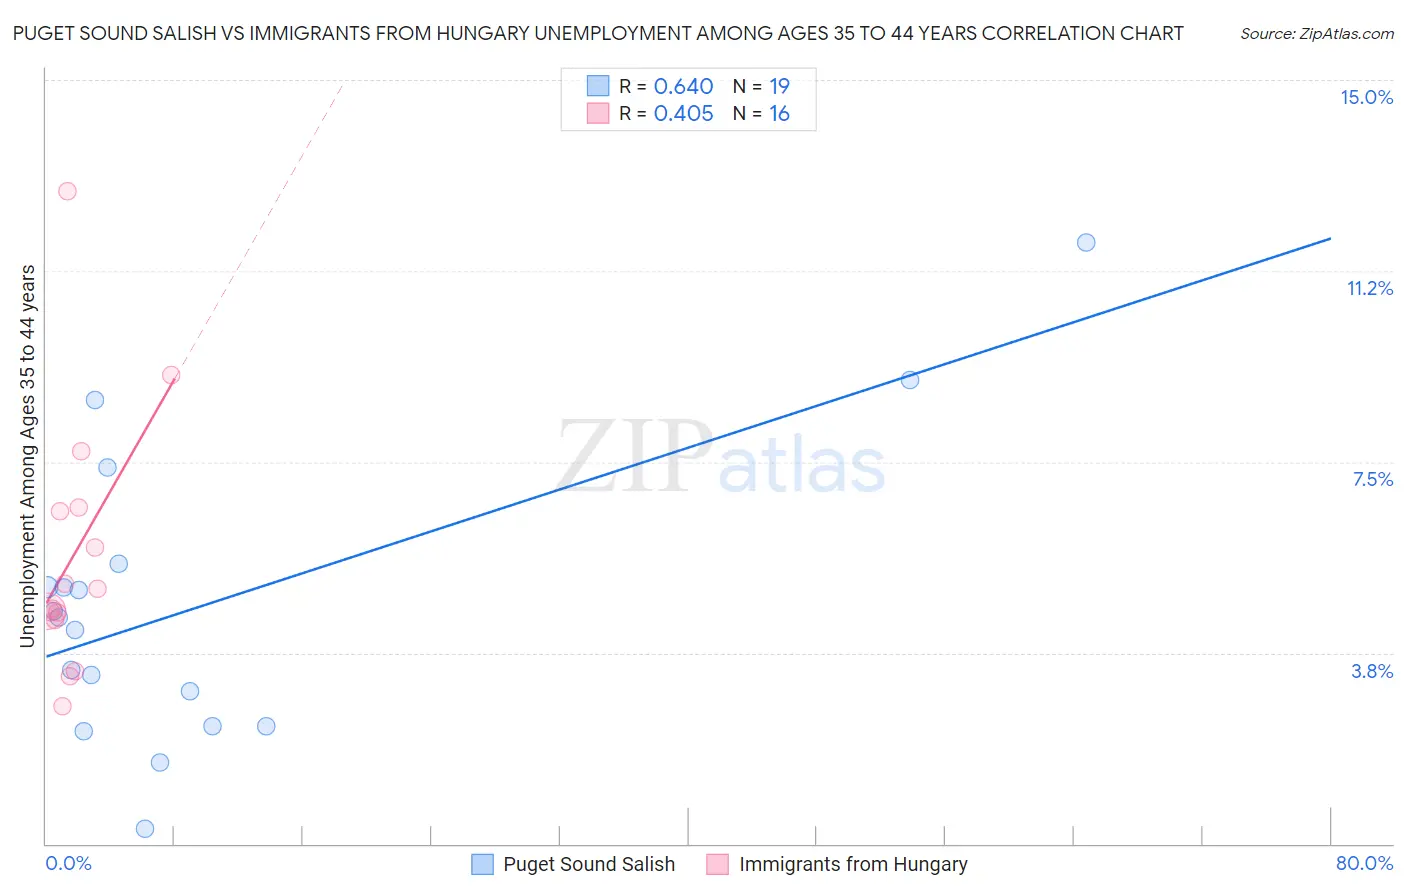
Puget Sound Salish vs Immigrants from Hungary Unemployment Among Ages 35 to 44 years Correlation Chart
The statistical analysis conducted on geographies consisting of 45,742,187 people shows a significant positive correlation between the proportion of Puget Sound Salish and unemployment rate among population between the ages 35 and 44 in the United States with a correlation coefficient (R) of 0.640 and weighted average of 4.6%. Similarly, the statistical analysis conducted on geographies consisting of 193,718,970 people shows a moderate positive correlation between the proportion of Immigrants from Hungary and unemployment rate among population between the ages 35 and 44 in the United States with a correlation coefficient (R) of 0.405 and weighted average of 4.6%, a difference of 0.82%.
Unemployment Among Ages 35 to 44 years Correlation Summary
| Measurement | Puget Sound Salish | Immigrants from Hungary |
| Minimum | 0.30% | 2.7% |
| Maximum | 11.8% | 12.8% |
| Range | 11.5% | 10.1% |
| Mean | 4.7% | 5.7% |
| Median | 4.4% | 4.8% |
| Interquartile 25% (IQ1) | 2.3% | 4.5% |
| Interquartile 75% (IQ3) | 5.5% | 6.6% |
| Interquartile Range (IQR) | 3.2% | 2.1% |
| Standard Deviation (Sample) | 2.9% | 2.5% |
| Standard Deviation (Population) | 2.8% | 2.5% |
Demographics Similar to Puget Sound Salish and Immigrants from Hungary by Unemployment Among Ages 35 to 44 years
In terms of unemployment among ages 35 to 44 years, the demographic groups most similar to Puget Sound Salish are Pakistani (4.6%, a difference of 0.0%), Immigrants from Brazil (4.6%, a difference of 0.010%), Immigrants from Western Europe (4.6%, a difference of 0.13%), White/Caucasian (4.6%, a difference of 0.18%), and Immigrants from England (4.6%, a difference of 0.29%). Similarly, the demographic groups most similar to Immigrants from Hungary are Immigrants from Eastern Africa (4.6%, a difference of 0.030%), Canadian (4.6%, a difference of 0.030%), Ukrainian (4.6%, a difference of 0.050%), Immigrants from Switzerland (4.6%, a difference of 0.080%), and Immigrants from Russia (4.6%, a difference of 0.090%).
| Demographics | Rating | Rank | Unemployment Among Ages 35 to 44 years |
| Immigrants | Europe | 79.4 /100 | #135 | Good 4.6% |
| Scotch-Irish | 79.3 /100 | #136 | Good 4.6% |
| Immigrants | Iraq | 78.9 /100 | #137 | Good 4.6% |
| Immigrants | Norway | 77.5 /100 | #138 | Good 4.6% |
| Immigrants | Hungary | 76.3 /100 | #139 | Good 4.6% |
| Immigrants | Eastern Africa | 76.0 /100 | #140 | Good 4.6% |
| Canadians | 75.9 /100 | #141 | Good 4.6% |
| Ukrainians | 75.8 /100 | #142 | Good 4.6% |
| Immigrants | Switzerland | 75.5 /100 | #143 | Good 4.6% |
| Immigrants | Russia | 75.4 /100 | #144 | Good 4.6% |
| Immigrants | Eastern Europe | 74.7 /100 | #145 | Good 4.6% |
| Immigrants | Denmark | 74.4 /100 | #146 | Good 4.6% |
| Immigrants | Vietnam | 73.8 /100 | #147 | Good 4.6% |
| Slavs | 72.4 /100 | #148 | Good 4.6% |
| Immigrants | Burma/Myanmar | 72.2 /100 | #149 | Good 4.6% |
| Immigrants | England | 70.5 /100 | #150 | Good 4.6% |
| Puget Sound Salish | 67.1 /100 | #151 | Good 4.6% |
| Pakistanis | 67.1 /100 | #152 | Good 4.6% |
| Immigrants | Brazil | 67.0 /100 | #153 | Good 4.6% |
| Immigrants | Western Europe | 65.5 /100 | #154 | Good 4.6% |
| Whites/Caucasians | 64.9 /100 | #155 | Good 4.6% |