Puerto Rican vs Ecuadorian In Labor Force | Age 20-64
COMPARE
Puerto Rican
Ecuadorian
In Labor Force | Age 20-64
In Labor Force | Age 20-64 Comparison
Puerto Ricans
Ecuadorians
73.1%
IN LABOR FORCE | AGE 20-64
0.0/ 100
METRIC RATING
338th/ 347
METRIC RANK
79.4%
IN LABOR FORCE | AGE 20-64
23.1/ 100
METRIC RATING
196th/ 347
METRIC RANK
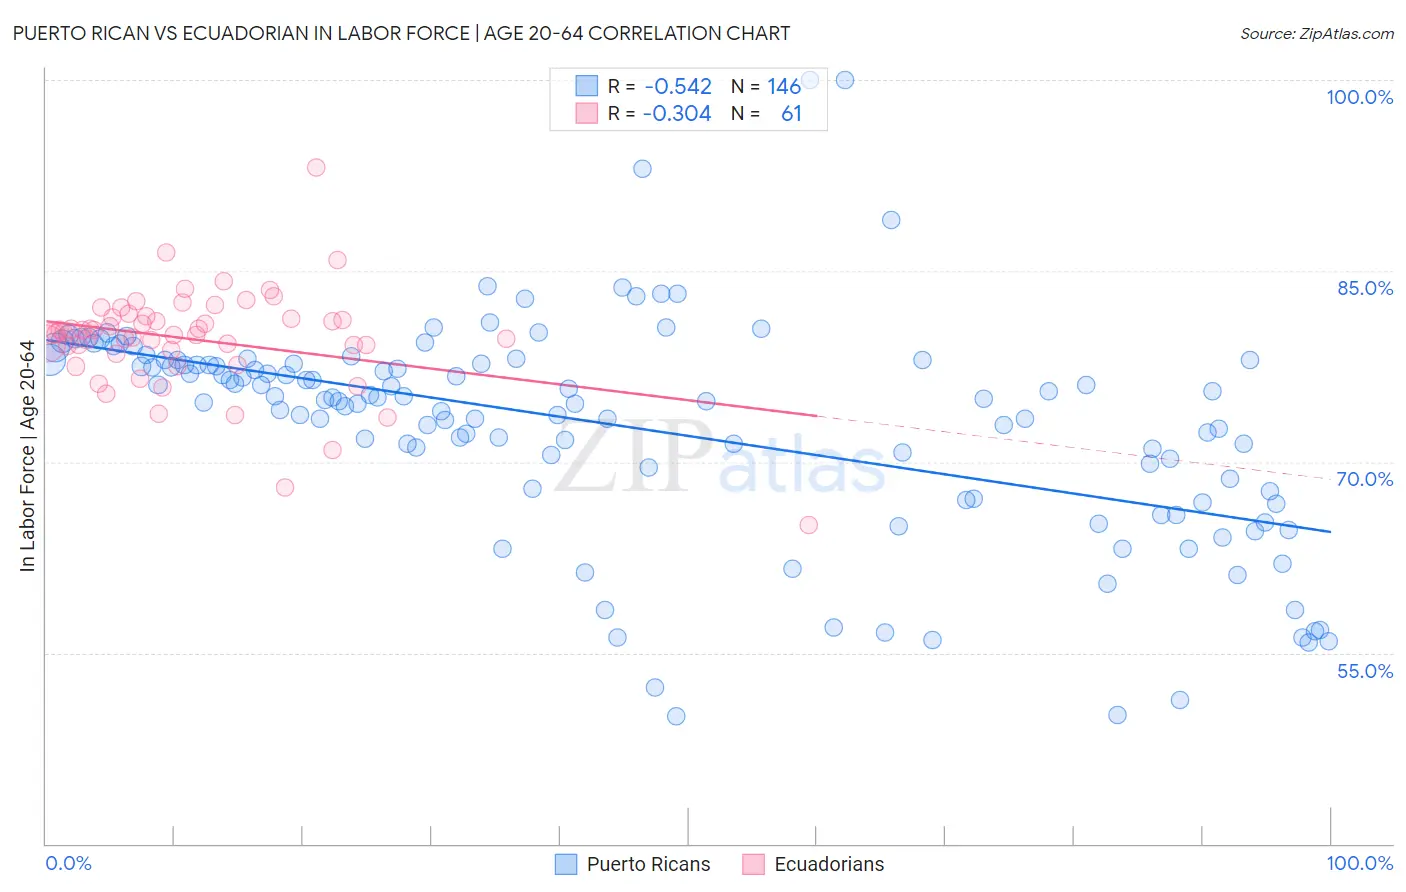
Puerto Rican vs Ecuadorian In Labor Force | Age 20-64 Correlation Chart
The statistical analysis conducted on geographies consisting of 528,297,294 people shows a substantial negative correlation between the proportion of Puerto Ricans and labor force participation rate among population between the ages 20 and 64 in the United States with a correlation coefficient (R) of -0.542 and weighted average of 73.1%. Similarly, the statistical analysis conducted on geographies consisting of 317,839,465 people shows a mild negative correlation between the proportion of Ecuadorians and labor force participation rate among population between the ages 20 and 64 in the United States with a correlation coefficient (R) of -0.304 and weighted average of 79.4%, a difference of 8.6%.
In Labor Force | Age 20-64 Correlation Summary
| Measurement | Puerto Rican | Ecuadorian |
| Minimum | 50.0% | 65.0% |
| Maximum | 100.0% | 93.1% |
| Range | 50.0% | 28.1% |
| Mean | 72.9% | 79.6% |
| Median | 74.9% | 80.1% |
| Interquartile 25% (IQ1) | 67.9% | 78.7% |
| Interquartile 75% (IQ3) | 78.0% | 81.4% |
| Interquartile Range (IQR) | 10.1% | 2.7% |
| Standard Deviation (Sample) | 8.7% | 4.1% |
| Standard Deviation (Population) | 8.7% | 4.1% |
Similar Demographics by In Labor Force | Age 20-64
Demographics Similar to Puerto Ricans by In Labor Force | Age 20-64
In terms of in labor force | age 20-64, the demographic groups most similar to Puerto Ricans are Yup'ik (73.2%, a difference of 0.21%), Crow (73.3%, a difference of 0.32%), Houma (72.7%, a difference of 0.43%), Pueblo (72.6%, a difference of 0.59%), and Ute (73.7%, a difference of 0.83%).
| Demographics | Rating | Rank | In Labor Force | Age 20-64 |
| Paiute | 0.0 /100 | #331 | Tragic 74.7% |
| Arapaho | 0.0 /100 | #332 | Tragic 74.4% |
| Natives/Alaskans | 0.0 /100 | #333 | Tragic 73.9% |
| Apache | 0.0 /100 | #334 | Tragic 73.7% |
| Ute | 0.0 /100 | #335 | Tragic 73.7% |
| Crow | 0.0 /100 | #336 | Tragic 73.3% |
| Yup'ik | 0.0 /100 | #337 | Tragic 73.2% |
| Puerto Ricans | 0.0 /100 | #338 | Tragic 73.1% |
| Houma | 0.0 /100 | #339 | Tragic 72.7% |
| Pueblo | 0.0 /100 | #340 | Tragic 72.6% |
| Immigrants | Yemen | 0.0 /100 | #341 | Tragic 72.3% |
| Yuman | 0.0 /100 | #342 | Tragic 71.7% |
| Hopi | 0.0 /100 | #343 | Tragic 71.7% |
| Lumbee | 0.0 /100 | #344 | Tragic 70.6% |
| Tohono O'odham | 0.0 /100 | #345 | Tragic 70.4% |
Demographics Similar to Ecuadorians by In Labor Force | Age 20-64
In terms of in labor force | age 20-64, the demographic groups most similar to Ecuadorians are Immigrants from Austria (79.4%, a difference of 0.010%), Immigrants from Senegal (79.4%, a difference of 0.010%), Immigrants from Thailand (79.4%, a difference of 0.020%), Immigrants from Laos (79.4%, a difference of 0.020%), and Indonesian (79.4%, a difference of 0.030%).
| Demographics | Rating | Rank | In Labor Force | Age 20-64 |
| Immigrants | El Salvador | 30.9 /100 | #189 | Fair 79.4% |
| Immigrants | Syria | 30.8 /100 | #190 | Fair 79.4% |
| Swiss | 28.9 /100 | #191 | Fair 79.4% |
| Immigrants | Denmark | 26.9 /100 | #192 | Fair 79.4% |
| Indonesians | 26.1 /100 | #193 | Fair 79.4% |
| Immigrants | Thailand | 24.8 /100 | #194 | Fair 79.4% |
| Immigrants | Austria | 23.7 /100 | #195 | Fair 79.4% |
| Ecuadorians | 23.1 /100 | #196 | Fair 79.4% |
| Immigrants | Senegal | 22.5 /100 | #197 | Fair 79.4% |
| Immigrants | Laos | 21.5 /100 | #198 | Fair 79.4% |
| Dutch | 20.2 /100 | #199 | Fair 79.3% |
| Immigrants | Oceania | 19.1 /100 | #200 | Poor 79.3% |
| Immigrants | Nicaragua | 19.0 /100 | #201 | Poor 79.3% |
| Nicaraguans | 18.3 /100 | #202 | Poor 79.3% |
| Iraqis | 17.7 /100 | #203 | Poor 79.3% |