Puerto Rican vs Tlingit-Haida In Labor Force | Age 20-64
COMPARE
Puerto Rican
Tlingit-Haida
In Labor Force | Age 20-64
In Labor Force | Age 20-64 Comparison
Puerto Ricans
Tlingit-Haida
73.1%
IN LABOR FORCE | AGE 20-64
0.0/ 100
METRIC RATING
338th/ 347
METRIC RANK
79.0%
IN LABOR FORCE | AGE 20-64
3.2/ 100
METRIC RATING
235th/ 347
METRIC RANK
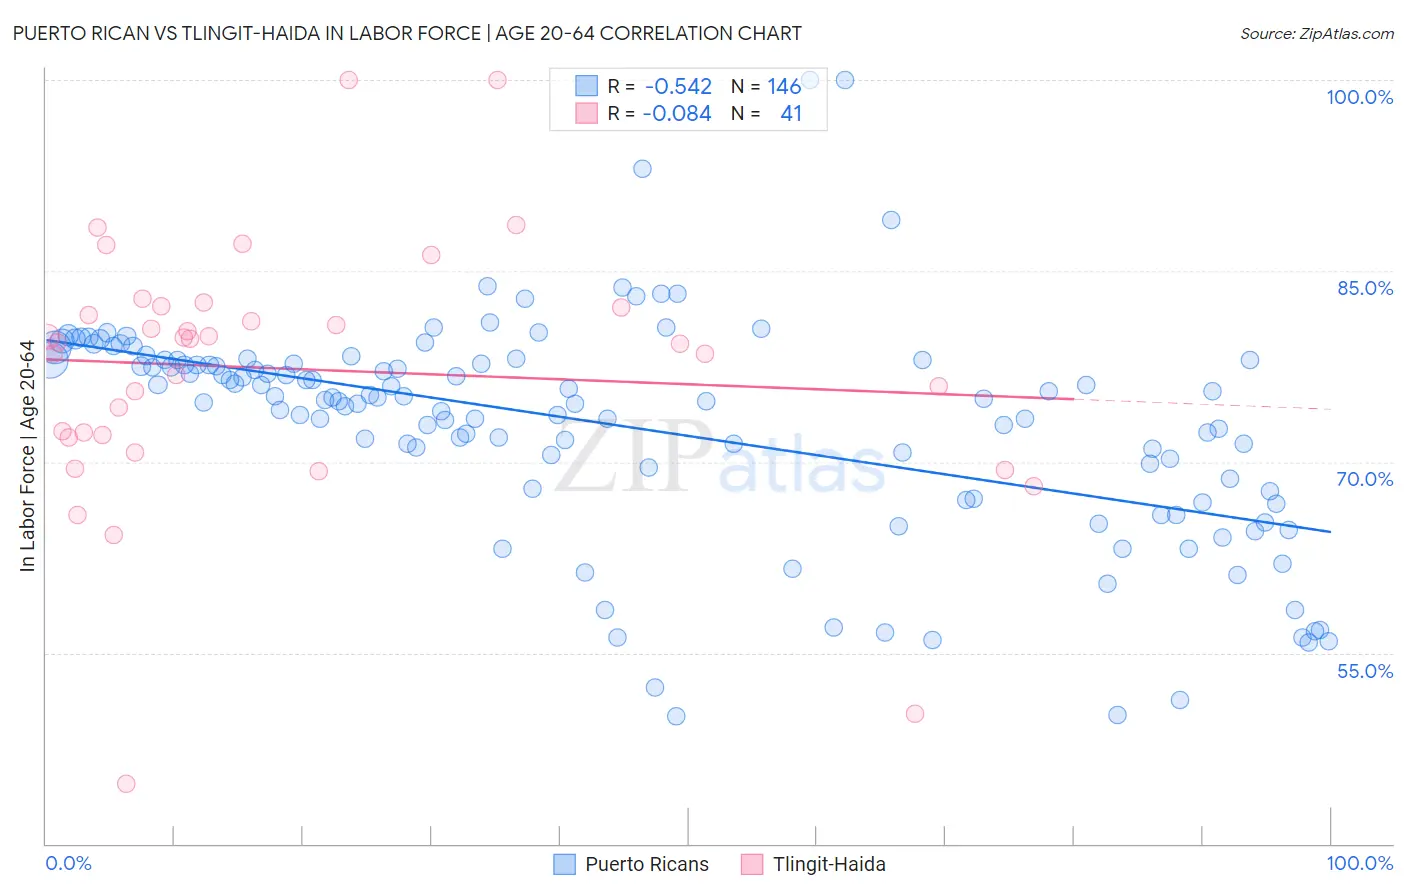
Puerto Rican vs Tlingit-Haida In Labor Force | Age 20-64 Correlation Chart
The statistical analysis conducted on geographies consisting of 528,297,294 people shows a substantial negative correlation between the proportion of Puerto Ricans and labor force participation rate among population between the ages 20 and 64 in the United States with a correlation coefficient (R) of -0.542 and weighted average of 73.1%. Similarly, the statistical analysis conducted on geographies consisting of 60,871,082 people shows a slight negative correlation between the proportion of Tlingit-Haida and labor force participation rate among population between the ages 20 and 64 in the United States with a correlation coefficient (R) of -0.084 and weighted average of 79.0%, a difference of 8.2%.
In Labor Force | Age 20-64 Correlation Summary
| Measurement | Puerto Rican | Tlingit-Haida |
| Minimum | 50.0% | 44.7% |
| Maximum | 100.0% | 100.0% |
| Range | 50.0% | 55.3% |
| Mean | 72.9% | 77.3% |
| Median | 74.9% | 79.4% |
| Interquartile 25% (IQ1) | 67.9% | 72.0% |
| Interquartile 75% (IQ3) | 78.0% | 82.1% |
| Interquartile Range (IQR) | 10.1% | 10.1% |
| Standard Deviation (Sample) | 8.7% | 10.4% |
| Standard Deviation (Population) | 8.7% | 10.2% |
Similar Demographics by In Labor Force | Age 20-64
Demographics Similar to Puerto Ricans by In Labor Force | Age 20-64
In terms of in labor force | age 20-64, the demographic groups most similar to Puerto Ricans are Yup'ik (73.2%, a difference of 0.21%), Crow (73.3%, a difference of 0.32%), Houma (72.7%, a difference of 0.43%), Pueblo (72.6%, a difference of 0.59%), and Ute (73.7%, a difference of 0.83%).
| Demographics | Rating | Rank | In Labor Force | Age 20-64 |
| Paiute | 0.0 /100 | #331 | Tragic 74.7% |
| Arapaho | 0.0 /100 | #332 | Tragic 74.4% |
| Natives/Alaskans | 0.0 /100 | #333 | Tragic 73.9% |
| Apache | 0.0 /100 | #334 | Tragic 73.7% |
| Ute | 0.0 /100 | #335 | Tragic 73.7% |
| Crow | 0.0 /100 | #336 | Tragic 73.3% |
| Yup'ik | 0.0 /100 | #337 | Tragic 73.2% |
| Puerto Ricans | 0.0 /100 | #338 | Tragic 73.1% |
| Houma | 0.0 /100 | #339 | Tragic 72.7% |
| Pueblo | 0.0 /100 | #340 | Tragic 72.6% |
| Immigrants | Yemen | 0.0 /100 | #341 | Tragic 72.3% |
| Yuman | 0.0 /100 | #342 | Tragic 71.7% |
| Hopi | 0.0 /100 | #343 | Tragic 71.7% |
| Lumbee | 0.0 /100 | #344 | Tragic 70.6% |
| Tohono O'odham | 0.0 /100 | #345 | Tragic 70.4% |
Demographics Similar to Tlingit-Haida by In Labor Force | Age 20-64
In terms of in labor force | age 20-64, the demographic groups most similar to Tlingit-Haida are Immigrants from Canada (79.0%, a difference of 0.0%), Samoan (79.0%, a difference of 0.020%), Immigrants from North America (79.0%, a difference of 0.020%), Immigrants from Jamaica (79.0%, a difference of 0.040%), and Japanese (79.1%, a difference of 0.050%).
| Demographics | Rating | Rank | In Labor Force | Age 20-64 |
| Panamanians | 5.7 /100 | #228 | Tragic 79.1% |
| Alsatians | 5.7 /100 | #229 | Tragic 79.1% |
| Native Hawaiians | 5.6 /100 | #230 | Tragic 79.1% |
| Lebanese | 5.1 /100 | #231 | Tragic 79.1% |
| Guamanians/Chamorros | 4.5 /100 | #232 | Tragic 79.1% |
| Japanese | 4.0 /100 | #233 | Tragic 79.1% |
| Immigrants | Canada | 3.2 /100 | #234 | Tragic 79.0% |
| Tlingit-Haida | 3.2 /100 | #235 | Tragic 79.0% |
| Samoans | 2.9 /100 | #236 | Tragic 79.0% |
| Immigrants | North America | 2.9 /100 | #237 | Tragic 79.0% |
| Immigrants | Jamaica | 2.6 /100 | #238 | Tragic 79.0% |
| Welsh | 2.4 /100 | #239 | Tragic 79.0% |
| Trinidadians and Tobagonians | 2.3 /100 | #240 | Tragic 79.0% |
| Jamaicans | 2.0 /100 | #241 | Tragic 78.9% |
| Immigrants | Micronesia | 1.9 /100 | #242 | Tragic 78.9% |