Potawatomi vs Slavic In Labor Force | Age 20-64
COMPARE
Potawatomi
Slavic
In Labor Force | Age 20-64
In Labor Force | Age 20-64 Comparison
Potawatomi
Slavs
77.2%
IN LABOR FORCE | AGE 20-64
0.0/ 100
METRIC RATING
306th/ 347
METRIC RANK
79.6%
IN LABOR FORCE | AGE 20-64
54.0/ 100
METRIC RATING
170th/ 347
METRIC RANK
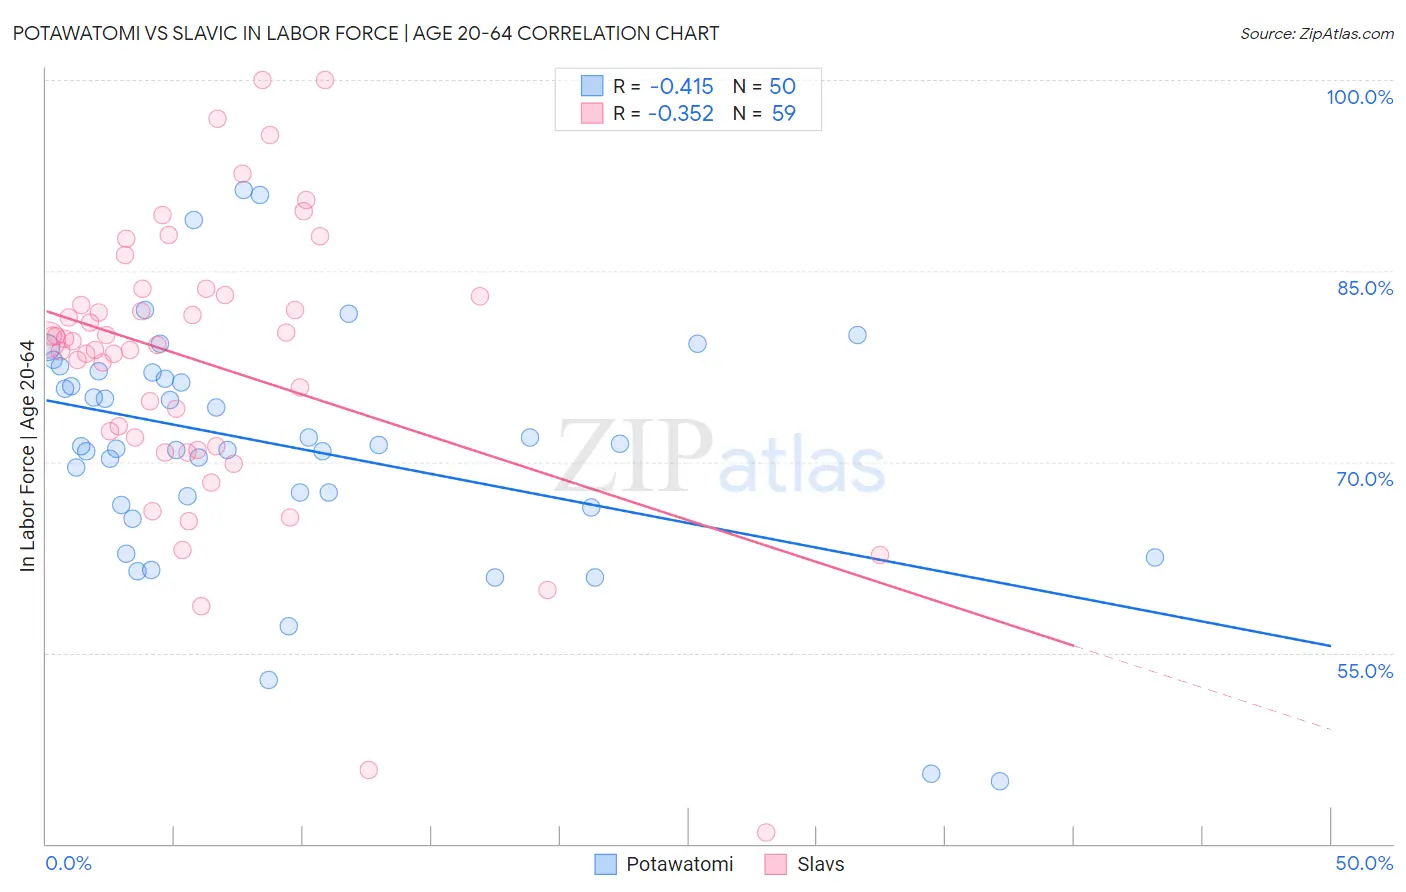
Potawatomi vs Slavic In Labor Force | Age 20-64 Correlation Chart
The statistical analysis conducted on geographies consisting of 117,773,870 people shows a moderate negative correlation between the proportion of Potawatomi and labor force participation rate among population between the ages 20 and 64 in the United States with a correlation coefficient (R) of -0.415 and weighted average of 77.2%. Similarly, the statistical analysis conducted on geographies consisting of 270,879,770 people shows a mild negative correlation between the proportion of Slavs and labor force participation rate among population between the ages 20 and 64 in the United States with a correlation coefficient (R) of -0.352 and weighted average of 79.6%, a difference of 3.1%.
In Labor Force | Age 20-64 Correlation Summary
| Measurement | Potawatomi | Slavic |
| Minimum | 44.9% | 40.9% |
| Maximum | 91.4% | 100.0% |
| Range | 46.5% | 59.1% |
| Mean | 71.2% | 77.8% |
| Median | 71.3% | 79.5% |
| Interquartile 25% (IQ1) | 66.7% | 71.2% |
| Interquartile 75% (IQ3) | 77.0% | 83.1% |
| Interquartile Range (IQR) | 10.4% | 11.9% |
| Standard Deviation (Sample) | 9.6% | 11.3% |
| Standard Deviation (Population) | 9.5% | 11.2% |
Similar Demographics by In Labor Force | Age 20-64
Demographics Similar to Potawatomi by In Labor Force | Age 20-64
In terms of in labor force | age 20-64, the demographic groups most similar to Potawatomi are Mexican (77.2%, a difference of 0.020%), Immigrants from Mexico (77.3%, a difference of 0.060%), Chippewa (77.3%, a difference of 0.12%), Central American Indian (77.1%, a difference of 0.17%), and Alaska Native (77.0%, a difference of 0.23%).
| Demographics | Rating | Rank | In Labor Force | Age 20-64 |
| Hispanics or Latinos | 0.0 /100 | #299 | Tragic 77.6% |
| Spanish American Indians | 0.0 /100 | #300 | Tragic 77.6% |
| Nepalese | 0.0 /100 | #301 | Tragic 77.5% |
| Iroquois | 0.0 /100 | #302 | Tragic 77.5% |
| Chippewa | 0.0 /100 | #303 | Tragic 77.3% |
| Immigrants | Mexico | 0.0 /100 | #304 | Tragic 77.3% |
| Mexicans | 0.0 /100 | #305 | Tragic 77.2% |
| Potawatomi | 0.0 /100 | #306 | Tragic 77.2% |
| Central American Indians | 0.0 /100 | #307 | Tragic 77.1% |
| Alaska Natives | 0.0 /100 | #308 | Tragic 77.0% |
| Americans | 0.0 /100 | #309 | Tragic 77.0% |
| Comanche | 0.0 /100 | #310 | Tragic 77.0% |
| Blackfeet | 0.0 /100 | #311 | Tragic 77.0% |
| Alaskan Athabascans | 0.0 /100 | #312 | Tragic 76.9% |
| Shoshone | 0.0 /100 | #313 | Tragic 76.8% |
Demographics Similar to Slavs by In Labor Force | Age 20-64
In terms of in labor force | age 20-64, the demographic groups most similar to Slavs are Immigrants from Switzerland (79.6%, a difference of 0.010%), Immigrants from Belgium (79.6%, a difference of 0.010%), Immigrants from Scotland (79.6%, a difference of 0.010%), Syrian (79.6%, a difference of 0.030%), and Laotian (79.6%, a difference of 0.040%).
| Demographics | Rating | Rank | In Labor Force | Age 20-64 |
| Immigrants | Costa Rica | 64.6 /100 | #163 | Good 79.7% |
| Immigrants | Burma/Myanmar | 64.4 /100 | #164 | Good 79.7% |
| Nigerians | 64.0 /100 | #165 | Good 79.7% |
| Okinawans | 62.7 /100 | #166 | Good 79.6% |
| Immigrants | Iraq | 62.0 /100 | #167 | Good 79.6% |
| Immigrants | Indonesia | 61.8 /100 | #168 | Good 79.6% |
| Laotians | 58.4 /100 | #169 | Average 79.6% |
| Slavs | 54.0 /100 | #170 | Average 79.6% |
| Immigrants | Switzerland | 53.3 /100 | #171 | Average 79.6% |
| Immigrants | Belgium | 53.1 /100 | #172 | Average 79.6% |
| Immigrants | Scotland | 52.4 /100 | #173 | Average 79.6% |
| Syrians | 50.0 /100 | #174 | Average 79.6% |
| Cubans | 46.1 /100 | #175 | Average 79.5% |
| Australians | 46.0 /100 | #176 | Average 79.5% |
| Immigrants | Netherlands | 45.2 /100 | #177 | Average 79.5% |