Potawatomi vs Immigrants from Caribbean In Labor Force | Age 20-64
COMPARE
Potawatomi
Immigrants from Caribbean
In Labor Force | Age 20-64
In Labor Force | Age 20-64 Comparison
Potawatomi
Immigrants from Caribbean
77.2%
IN LABOR FORCE | AGE 20-64
0.0/ 100
METRIC RATING
306th/ 347
METRIC RANK
78.8%
IN LABOR FORCE | AGE 20-64
1.0/ 100
METRIC RATING
248th/ 347
METRIC RANK
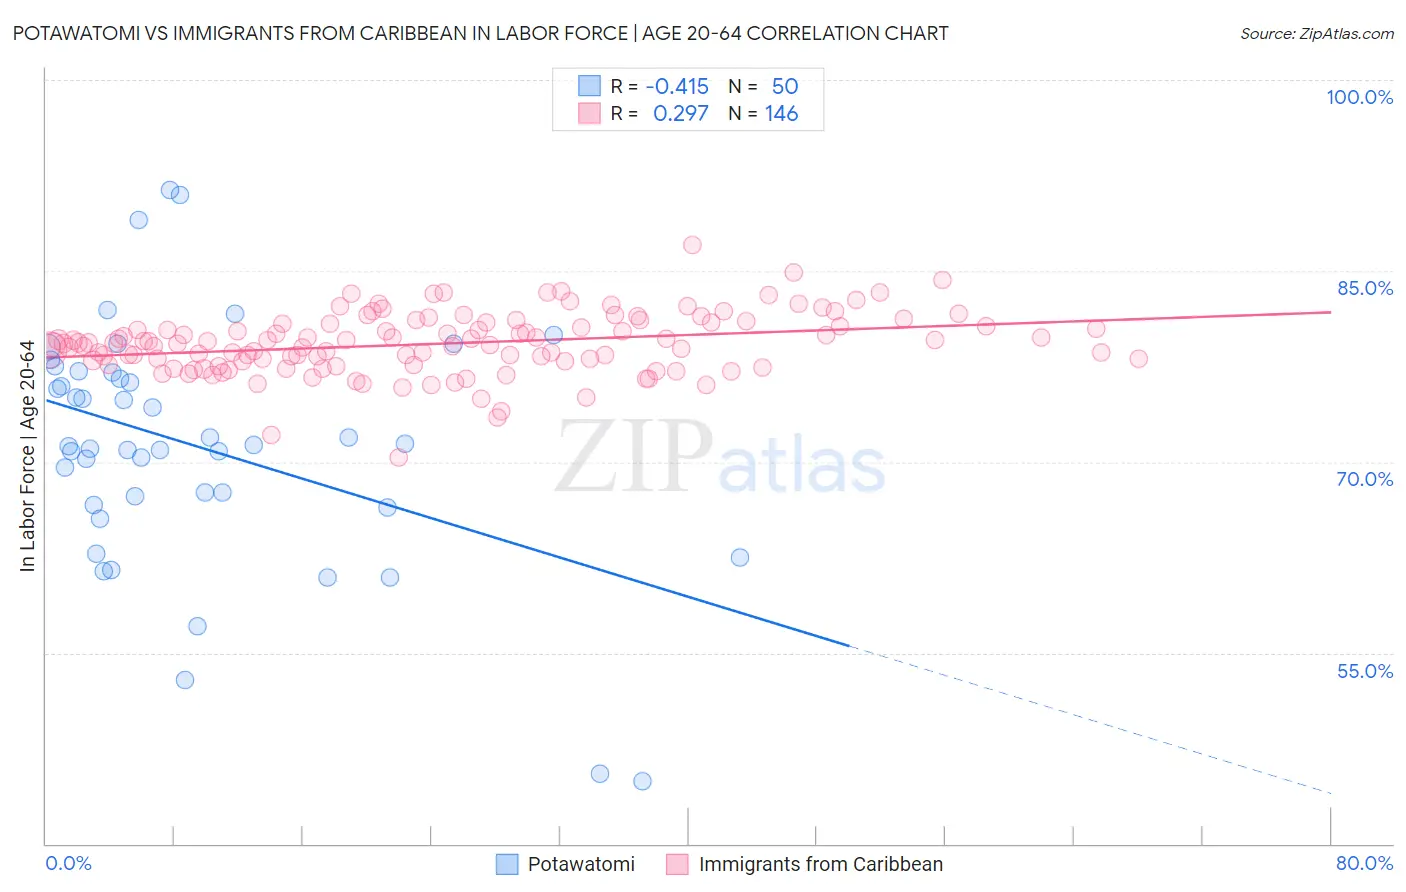
Potawatomi vs Immigrants from Caribbean In Labor Force | Age 20-64 Correlation Chart
The statistical analysis conducted on geographies consisting of 117,773,870 people shows a moderate negative correlation between the proportion of Potawatomi and labor force participation rate among population between the ages 20 and 64 in the United States with a correlation coefficient (R) of -0.415 and weighted average of 77.2%. Similarly, the statistical analysis conducted on geographies consisting of 450,041,805 people shows a weak positive correlation between the proportion of Immigrants from Caribbean and labor force participation rate among population between the ages 20 and 64 in the United States with a correlation coefficient (R) of 0.297 and weighted average of 78.8%, a difference of 2.1%.
In Labor Force | Age 20-64 Correlation Summary
| Measurement | Potawatomi | Immigrants from Caribbean |
| Minimum | 44.9% | 70.3% |
| Maximum | 91.4% | 87.0% |
| Range | 46.5% | 16.7% |
| Mean | 71.2% | 79.3% |
| Median | 71.3% | 79.3% |
| Interquartile 25% (IQ1) | 66.7% | 77.9% |
| Interquartile 75% (IQ3) | 77.0% | 80.9% |
| Interquartile Range (IQR) | 10.4% | 3.0% |
| Standard Deviation (Sample) | 9.6% | 2.4% |
| Standard Deviation (Population) | 9.5% | 2.4% |
Similar Demographics by In Labor Force | Age 20-64
Demographics Similar to Potawatomi by In Labor Force | Age 20-64
In terms of in labor force | age 20-64, the demographic groups most similar to Potawatomi are Mexican (77.2%, a difference of 0.020%), Immigrants from Mexico (77.3%, a difference of 0.060%), Chippewa (77.3%, a difference of 0.12%), Central American Indian (77.1%, a difference of 0.17%), and Alaska Native (77.0%, a difference of 0.23%).
| Demographics | Rating | Rank | In Labor Force | Age 20-64 |
| Hispanics or Latinos | 0.0 /100 | #299 | Tragic 77.6% |
| Spanish American Indians | 0.0 /100 | #300 | Tragic 77.6% |
| Nepalese | 0.0 /100 | #301 | Tragic 77.5% |
| Iroquois | 0.0 /100 | #302 | Tragic 77.5% |
| Chippewa | 0.0 /100 | #303 | Tragic 77.3% |
| Immigrants | Mexico | 0.0 /100 | #304 | Tragic 77.3% |
| Mexicans | 0.0 /100 | #305 | Tragic 77.2% |
| Potawatomi | 0.0 /100 | #306 | Tragic 77.2% |
| Central American Indians | 0.0 /100 | #307 | Tragic 77.1% |
| Alaska Natives | 0.0 /100 | #308 | Tragic 77.0% |
| Americans | 0.0 /100 | #309 | Tragic 77.0% |
| Comanche | 0.0 /100 | #310 | Tragic 77.0% |
| Blackfeet | 0.0 /100 | #311 | Tragic 77.0% |
| Alaskan Athabascans | 0.0 /100 | #312 | Tragic 76.9% |
| Shoshone | 0.0 /100 | #313 | Tragic 76.8% |
Demographics Similar to Immigrants from Caribbean by In Labor Force | Age 20-64
In terms of in labor force | age 20-64, the demographic groups most similar to Immigrants from Caribbean are Immigrants from Germany (78.8%, a difference of 0.010%), Immigrants from Trinidad and Tobago (78.8%, a difference of 0.020%), English (78.8%, a difference of 0.030%), Honduran (78.8%, a difference of 0.030%), and Scottish (78.9%, a difference of 0.050%).
| Demographics | Rating | Rank | In Labor Force | Age 20-64 |
| Jamaicans | 2.0 /100 | #241 | Tragic 78.9% |
| Immigrants | Micronesia | 1.9 /100 | #242 | Tragic 78.9% |
| Immigrants | West Indies | 1.7 /100 | #243 | Tragic 78.9% |
| French | 1.5 /100 | #244 | Tragic 78.9% |
| Scottish | 1.3 /100 | #245 | Tragic 78.9% |
| Immigrants | Trinidad and Tobago | 1.1 /100 | #246 | Tragic 78.8% |
| Immigrants | Germany | 1.0 /100 | #247 | Tragic 78.8% |
| Immigrants | Caribbean | 1.0 /100 | #248 | Tragic 78.8% |
| English | 0.9 /100 | #249 | Tragic 78.8% |
| Hondurans | 0.8 /100 | #250 | Tragic 78.8% |
| Barbadians | 0.7 /100 | #251 | Tragic 78.8% |
| Immigrants | Honduras | 0.6 /100 | #252 | Tragic 78.7% |
| Basques | 0.5 /100 | #253 | Tragic 78.7% |
| Immigrants | Lebanon | 0.5 /100 | #254 | Tragic 78.7% |
| Hawaiians | 0.5 /100 | #255 | Tragic 78.7% |