Finnish vs Slavic In Labor Force | Age 20-64
COMPARE
Finnish
Slavic
In Labor Force | Age 20-64
In Labor Force | Age 20-64 Comparison
Finns
Slavs
79.5%
IN LABOR FORCE | AGE 20-64
35.9/ 100
METRIC RATING
184th/ 347
METRIC RANK
79.6%
IN LABOR FORCE | AGE 20-64
54.0/ 100
METRIC RATING
170th/ 347
METRIC RANK
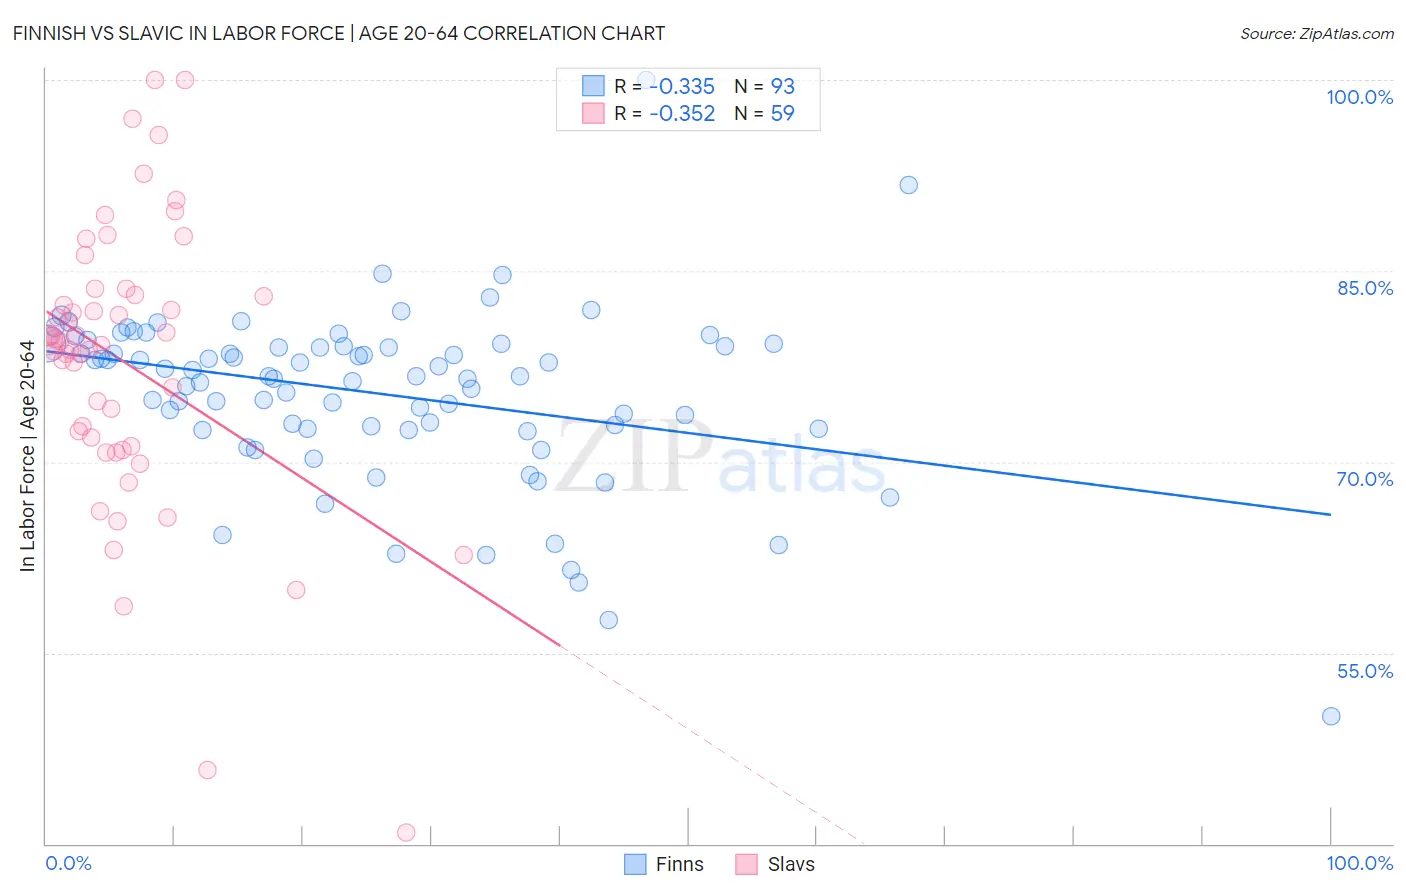
Finnish vs Slavic In Labor Force | Age 20-64 Correlation Chart
The statistical analysis conducted on geographies consisting of 404,683,830 people shows a mild negative correlation between the proportion of Finns and labor force participation rate among population between the ages 20 and 64 in the United States with a correlation coefficient (R) of -0.335 and weighted average of 79.5%. Similarly, the statistical analysis conducted on geographies consisting of 270,879,770 people shows a mild negative correlation between the proportion of Slavs and labor force participation rate among population between the ages 20 and 64 in the United States with a correlation coefficient (R) of -0.352 and weighted average of 79.6%, a difference of 0.15%.
In Labor Force | Age 20-64 Correlation Summary
| Measurement | Finnish | Slavic |
| Minimum | 50.0% | 40.9% |
| Maximum | 100.0% | 100.0% |
| Range | 50.0% | 59.1% |
| Mean | 75.4% | 77.8% |
| Median | 76.7% | 79.5% |
| Interquartile 25% (IQ1) | 72.6% | 71.2% |
| Interquartile 75% (IQ3) | 79.2% | 83.1% |
| Interquartile Range (IQR) | 6.5% | 11.9% |
| Standard Deviation (Sample) | 6.9% | 11.3% |
| Standard Deviation (Population) | 6.8% | 11.2% |
Demographics Similar to Finns and Slavs by In Labor Force | Age 20-64
In terms of in labor force | age 20-64, the demographic groups most similar to Finns are Malaysian (79.5%, a difference of 0.010%), Immigrants from Hungary (79.5%, a difference of 0.010%), Israeli (79.5%, a difference of 0.010%), Northern European (79.5%, a difference of 0.010%), and Immigrants from Saudi Arabia (79.5%, a difference of 0.020%). Similarly, the demographic groups most similar to Slavs are Immigrants from Switzerland (79.6%, a difference of 0.010%), Immigrants from Belgium (79.6%, a difference of 0.010%), Immigrants from Scotland (79.6%, a difference of 0.010%), Syrian (79.6%, a difference of 0.030%), and Laotian (79.6%, a difference of 0.040%).
| Demographics | Rating | Rank | In Labor Force | Age 20-64 |
| Immigrants | Iraq | 62.0 /100 | #167 | Good 79.6% |
| Immigrants | Indonesia | 61.8 /100 | #168 | Good 79.6% |
| Laotians | 58.4 /100 | #169 | Average 79.6% |
| Slavs | 54.0 /100 | #170 | Average 79.6% |
| Immigrants | Switzerland | 53.3 /100 | #171 | Average 79.6% |
| Immigrants | Belgium | 53.1 /100 | #172 | Average 79.6% |
| Immigrants | Scotland | 52.4 /100 | #173 | Average 79.6% |
| Syrians | 50.0 /100 | #174 | Average 79.6% |
| Cubans | 46.1 /100 | #175 | Average 79.5% |
| Australians | 46.0 /100 | #176 | Average 79.5% |
| Immigrants | Netherlands | 45.2 /100 | #177 | Average 79.5% |
| Czechoslovakians | 44.3 /100 | #178 | Average 79.5% |
| Armenians | 41.4 /100 | #179 | Average 79.5% |
| Salvadorans | 41.0 /100 | #180 | Average 79.5% |
| Immigrants | Saudi Arabia | 37.7 /100 | #181 | Fair 79.5% |
| Malaysians | 37.1 /100 | #182 | Fair 79.5% |
| Immigrants | Hungary | 36.8 /100 | #183 | Fair 79.5% |
| Finns | 35.9 /100 | #184 | Fair 79.5% |
| Israelis | 34.7 /100 | #185 | Fair 79.5% |
| Northern Europeans | 34.5 /100 | #186 | Fair 79.5% |
| Assyrians/Chaldeans/Syriacs | 33.3 /100 | #187 | Fair 79.4% |