Immigrants from Argentina vs Slavic In Labor Force | Age 20-64

COMPARE

Immigrants from Argentina
Race
Ancestry
AfghanAfricanAlaska NativeAlaskan AthabascanAlbanianAleutAlsatianAmericanApacheArabArapahoArgentineanArmenianAssyrian/Chaldean/SyriacAustralianAustrianBahamianBangladeshiBarbadianBasqueBelgianBelizeanBermudanBhutaneseBlackfeetBolivianBrazilianBritishBritish West IndianBulgarianBurmeseCajunCambodianCanadianCape VerdeanCarpatho RusynCelticCentral AmericanCentral American IndianCherokeeCheyenneChickasawChileanChineseChippewaChoctawColombianColvilleComancheCosta RicanCreeCreekCroatianCrowCubanCypriotCzechCzechoslovakianDanishDelawareDominicanDutchDutch West IndianEastern EuropeanEcuadorianEgyptianEnglishEstonianEthiopianEuropeanFijianFilipinoFinnishFrenchFrench American IndianFrench CanadianGermanGerman RussianGhanaianGreekGuamanian/ChamorroGuatemalanGuyaneseHaitianHmongHonduranHopiHoumaHungarianIcelanderIndian (Asian)IndonesianInupiatIranianIraqiIrishIroquoisIsraeliItalianJamaicanJapaneseJordanianKenyanKiowaKoreanLaotianLatvianLebaneseLiberianLithuanianLumbeeLuxembourgerMacedonianMalaysianMalteseMarshalleseMenomineeMexicanMexican American IndianMongolianMoroccanNative HawaiianNavajoNepaleseNew ZealanderNicaraguanNigerianNorthern EuropeanNorwegianOkinawanOsageOttawaPaiutePakistaniPalestinianPanamanianParaguayanPennsylvania GermanPeruvianPimaPolishPortuguesePotawatomiPuebloPuerto RicanPuget Sound SalishRomanianRussianSalvadoranSamoanScandinavianScotch-IrishScottishSeminoleSenegaleseSerbianShoshoneSierra LeoneanSiouxSlovakSloveneSomaliSouth AfricanSouth AmericanSouth American IndianSoviet UnionSpaniardSpanishSpanish AmericanSpanish American IndianSri LankanSubsaharan AfricanSudaneseSwedishSwissSyrianTaiwaneseThaiTlingit-HaidaTohono O'OdhamTonganTrinidadian and TobagonianTsimshianTurkishU.S. Virgin IslanderUgandanUkrainianUruguayanUteVenezuelanVietnameseWelshWest IndianYakamaYaquiYugoslavianYumanYup'ikZimbabwean
Immigration
NonimmigrantsImmigrantsAfghanistanAfricaAlbaniaArgentinaArmeniaAsiaAustraliaAustriaBahamasBangladeshBarbadosBelarusBelgiumBelizeBoliviaBosnia and HerzegovinaBrazilBulgariaBurma/MyanmarCabo VerdeCambodiaCameroonCanadaCaribbeanCentral AmericaChileChinaColombiaCongoCosta RicaCroatiaCubaCzechoslovakiaDenmarkDominicaDominican RepublicEastern AfricaEastern AsiaEastern EuropeEcuadorEgyptEl SalvadorEnglandEritreaEthiopiaEuropeFijiFranceGermanyGhanaGreeceGrenadaGuatemalaGuyanaHaitiHondurasHong KongHungaryIndiaIndonesiaIranIraqIrelandIsraelItalyJamaicaJapanJordanKazakhstanKenyaKoreaKuwaitLaosLatin AmericaLatviaLebanonLiberiaLithuaniaMalaysiaMexicoMicronesiaMiddle AfricaMoldovaMoroccoNepalNetherlandsNicaraguaNigeriaNorth AmericaNorth MacedoniaNorthern AfricaNorthern EuropeNorwayOceaniaPakistanPanamaPeruPhilippinesPolandPortugalRomaniaRussiaSaudi ArabiaScotlandSenegalSerbiaSierra LeoneSingaporeSomaliaSouth AfricaSouth AmericaSouth Central AsiaSouth Eastern AsiaSouthern EuropeSpainSri LankaSt. Vincent and the GrenadinesSudanSwedenSwitzerlandSyriaTaiwanThailandTrinidad and TobagoTurkeyUgandaUkraineUruguayUzbekistanVenezuelaVietnamWest IndiesWestern AfricaWestern AsiaWestern EuropeYemenZaireZimbabweAzores
Slavic
Race
Ancestry
AfghanAfricanAlaska NativeAlaskan AthabascanAlbanianAleutAlsatianAmericanApacheArabArapahoArgentineanArmenianAssyrian/Chaldean/SyriacAustralianAustrianBahamianBangladeshiBarbadianBasqueBelgianBelizeanBermudanBhutaneseBlackfeetBolivianBrazilianBritishBritish West IndianBulgarianBurmeseCajunCambodianCanadianCape VerdeanCarpatho RusynCelticCentral AmericanCentral American IndianCherokeeCheyenneChickasawChileanChineseChippewaChoctawColombianColvilleComancheCosta RicanCreeCreekCroatianCrowCubanCypriotCzechCzechoslovakianDanishDelawareDominicanDutchDutch West IndianEastern EuropeanEcuadorianEgyptianEnglishEstonianEthiopianEuropeanFijianFilipinoFinnishFrenchFrench American IndianFrench CanadianGermanGerman RussianGhanaianGreekGuamanian/ChamorroGuatemalanGuyaneseHaitianHmongHonduranHopiHoumaHungarianIcelanderIndian (Asian)IndonesianInupiatIranianIraqiIrishIroquoisIsraeliItalianJamaicanJapaneseJordanianKenyanKiowaKoreanLaotianLatvianLebaneseLiberianLithuanianLumbeeLuxembourgerMacedonianMalaysianMalteseMarshalleseMenomineeMexicanMexican American IndianMongolianMoroccanNative HawaiianNavajoNepaleseNew ZealanderNicaraguanNigerianNorthern EuropeanNorwegianOkinawanOsageOttawaPaiutePakistaniPalestinianPanamanianParaguayanPennsylvania GermanPeruvianPimaPolishPortuguesePotawatomiPuebloPuerto RicanPuget Sound SalishRomanianRussianSalvadoranSamoanScandinavianScotch-IrishScottishSeminoleSenegaleseSerbianShoshoneSierra LeoneanSiouxSlavicSlovakSloveneSomaliSouth AfricanSouth AmericanSouth American IndianSoviet UnionSpaniardSpanishSpanish AmericanSpanish American IndianSri LankanSubsaharan AfricanSudaneseSwedishSwissSyrianTaiwaneseThaiTlingit-HaidaTohono O'OdhamTonganTrinidadian and TobagonianTsimshianTurkishU.S. Virgin IslanderUgandanUkrainianUruguayanUteVenezuelanVietnameseWelshWest IndianYakamaYaquiYugoslavianYumanYup'ikZimbabwean
Immigration
NonimmigrantsImmigrantsAfghanistanAfricaAlbaniaArmeniaAsiaAustraliaAustriaBahamasBangladeshBarbadosBelarusBelgiumBelizeBoliviaBosnia and HerzegovinaBrazilBulgariaBurma/MyanmarCabo VerdeCambodiaCameroonCanadaCaribbeanCentral AmericaChileChinaColombiaCongoCosta RicaCroatiaCubaCzechoslovakiaDenmarkDominicaDominican RepublicEastern AfricaEastern AsiaEastern EuropeEcuadorEgyptEl SalvadorEnglandEritreaEthiopiaEuropeFijiFranceGermanyGhanaGreeceGrenadaGuatemalaGuyanaHaitiHondurasHong KongHungaryIndiaIndonesiaIranIraqIrelandIsraelItalyJamaicaJapanJordanKazakhstanKenyaKoreaKuwaitLaosLatin AmericaLatviaLebanonLiberiaLithuaniaMalaysiaMexicoMicronesiaMiddle AfricaMoldovaMoroccoNepalNetherlandsNicaraguaNigeriaNorth AmericaNorth MacedoniaNorthern AfricaNorthern EuropeNorwayOceaniaPakistanPanamaPeruPhilippinesPolandPortugalRomaniaRussiaSaudi ArabiaScotlandSenegalSerbiaSierra LeoneSingaporeSomaliaSouth AfricaSouth AmericaSouth Central AsiaSouth Eastern AsiaSouthern EuropeSpainSri LankaSt. Vincent and the GrenadinesSudanSwedenSwitzerlandSyriaTaiwanThailandTrinidad and TobagoTurkeyUgandaUkraineUruguayUzbekistanVenezuelaVietnamWest IndiesWestern AfricaWestern AsiaWestern EuropeYemenZaireZimbabweAzores
In Labor Force | Age 20-64
Income
Poverty
Unemployment
Labor Participation
Family Structure
Vehicle Availability
Education Level
Disability

In Labor Force | Age 20-64 Comparison

Immigrants from Argentina

Slavs

Exceptional
Average
80.0%
IN LABOR FORCE | AGE 20-64
94.1/ 100
METRIC RATING
109th/ 347
METRIC RANK
79.6%
IN LABOR FORCE | AGE 20-64
54.0/ 100
METRIC RATING
170th/ 347
METRIC RANK

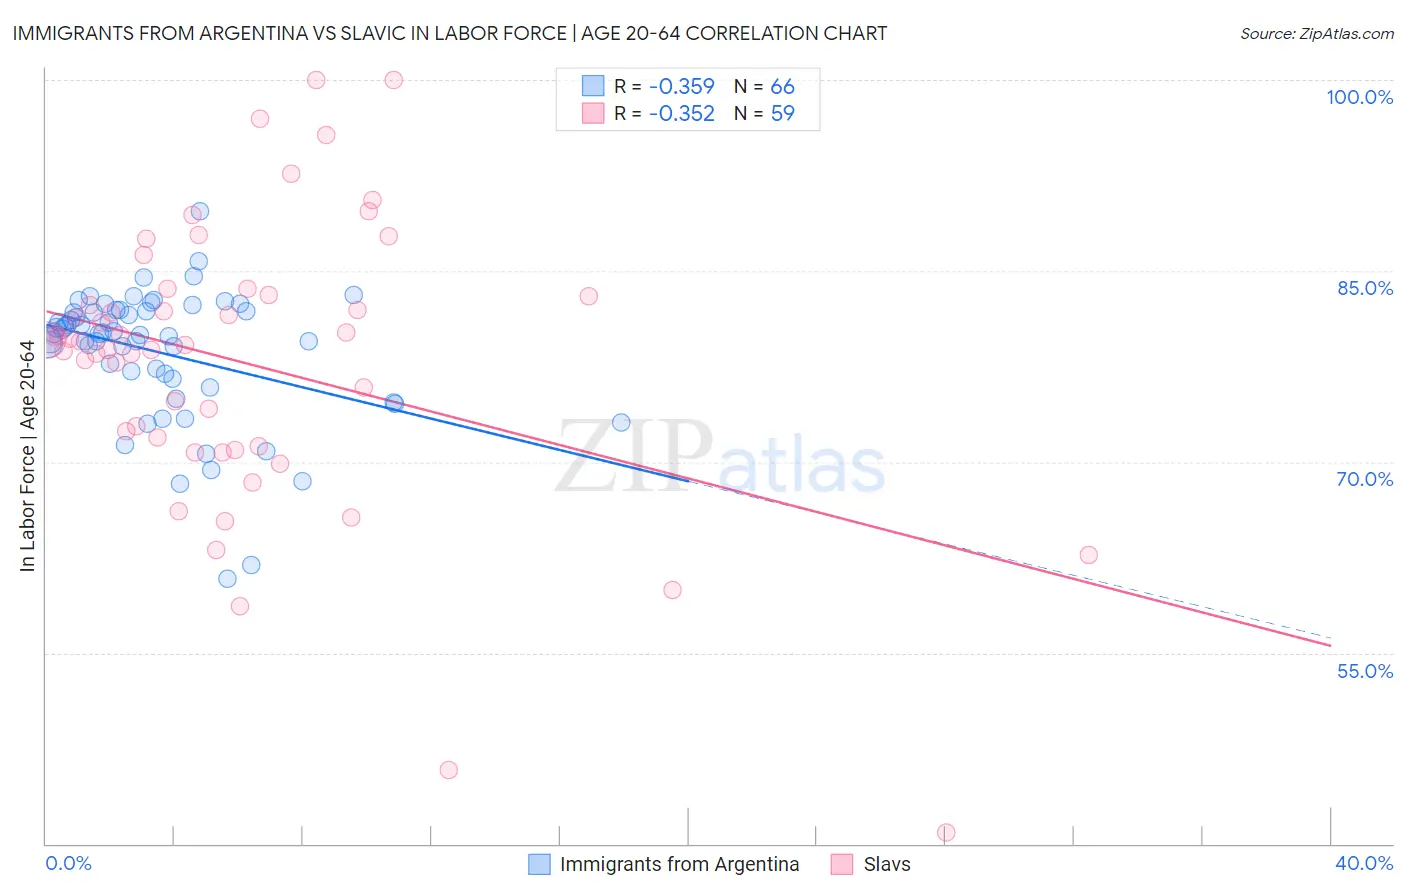
Immigrants from Argentina vs Slavic In Labor Force | Age 20-64 Correlation Chart

The statistical analysis conducted on geographies consisting of 264,436,080 people shows a mild negative correlation between the proportion of Immigrants from Argentina and labor force participation rate among population between the ages 20 and 64 in the United States with a correlation coefficient (R) of -0.359 and weighted average of 80.0%. Similarly, the statistical analysis conducted on geographies consisting of 270,879,770 people shows a mild negative correlation between the proportion of Slavs and labor force participation rate among population between the ages 20 and 64 in the United States with a correlation coefficient (R) of -0.352 and weighted average of 79.6%, a difference of 0.52%.
Immigrants from Argentina vs Slavic In Labor Force | Age 20-64

In Labor Force | Age 20-64 Correlation Summary

MeasurementImmigrants from ArgentinaSlavic
Minimum60.8%40.9%
Maximum89.7%100.0%
Range28.9%59.1%
Mean78.6%77.8%
Median80.1%79.5%
Interquartile 25% (IQ1)76.5%71.2%
Interquartile 75% (IQ3)81.8%83.1%
Interquartile Range (IQR)5.3%11.9%
Standard Deviation (Sample)5.3%11.3%
Standard Deviation (Population)5.2%11.2%

Similar Demographics by In Labor Force | Age 20-64

Demographics Similar to Immigrants from Argentina by In Labor Force | Age 20-64

In terms of in labor force | age 20-64, the demographic groups most similar to Immigrants from Argentina are Estonian (80.0%, a difference of 0.0%), Iranian (80.0%, a difference of 0.010%), Immigrants from South America (80.0%, a difference of 0.010%), Immigrants from Italy (80.0%, a difference of 0.010%), and Sri Lankan (80.0%, a difference of 0.010%).
DemographicsRating | RankIn Labor Force | Age 20-64
Immigrants | Australia
95.5
/100
|
#102
Exceptional
80.0%
Russians
95.5
/100
|
#103
Exceptional
80.0%
Venezuelans
95.3
/100
|
#104
Exceptional
80.0%
Immigrants | Ghana
95.0
/100
|
#105
Exceptional
80.0%
Greeks
94.8
/100
|
#106
Exceptional
80.0%
Immigrants | Jordan
94.8
/100
|
#107
Exceptional
80.0%
Iranians
94.3
/100
|
#108
Exceptional
80.0%
Immigrants | Argentina
94.1
/100
|
#109
Exceptional
80.0%
Estonians
94.0
/100
|
#110
Exceptional
80.0%
Immigrants | South America
93.9
/100
|
#111
Exceptional
80.0%
Immigrants | Italy
93.9
/100
|
#112
Exceptional
80.0%
Sri Lankans
93.9
/100
|
#113
Exceptional
80.0%
Argentineans
93.8
/100
|
#114
Exceptional
80.0%
Bermudans
93.3
/100
|
#115
Exceptional
80.0%
Immigrants | Western Africa
93.1
/100
|
#116
Exceptional
80.0%

Demographics Similar to Slavs by In Labor Force | Age 20-64

In terms of in labor force | age 20-64, the demographic groups most similar to Slavs are Immigrants from Switzerland (79.6%, a difference of 0.010%), Immigrants from Belgium (79.6%, a difference of 0.010%), Immigrants from Scotland (79.6%, a difference of 0.010%), Syrian (79.6%, a difference of 0.030%), and Laotian (79.6%, a difference of 0.040%).
DemographicsRating | RankIn Labor Force | Age 20-64
Immigrants | Costa Rica
64.6
/100
|
#163
Good
79.7%
Immigrants | Burma/Myanmar
64.4
/100
|
#164
Good
79.7%
Nigerians
64.0
/100
|
#165
Good
79.7%
Okinawans
62.7
/100
|
#166
Good
79.6%
Immigrants | Iraq
62.0
/100
|
#167
Good
79.6%
Immigrants | Indonesia
61.8
/100
|
#168
Good
79.6%
Laotians
58.4
/100
|
#169
Average
79.6%
Slavs
54.0
/100
|
#170
Average
79.6%
Immigrants | Switzerland
53.3
/100
|
#171
Average
79.6%
Immigrants | Belgium
53.1
/100
|
#172
Average
79.6%
Immigrants | Scotland
52.4
/100
|
#173
Average
79.6%
Syrians
50.0
/100
|
#174
Average
79.6%
Cubans
46.1
/100
|
#175
Average
79.5%
Australians
46.0
/100
|
#176
Average
79.5%
Immigrants | Netherlands
45.2
/100
|
#177
Average
79.5%