Potawatomi vs Immigrants In Labor Force | Age 20-24
COMPARE
Potawatomi
Immigrants
In Labor Force | Age 20-24
In Labor Force | Age 20-24 Comparison
Potawatomi
Immigrants
76.2%
IN LABOR FORCE | AGE 20-24
98.5/ 100
METRIC RATING
94th/ 347
METRIC RANK
74.1%
IN LABOR FORCE | AGE 20-24
3.6/ 100
METRIC RATING
234th/ 347
METRIC RANK
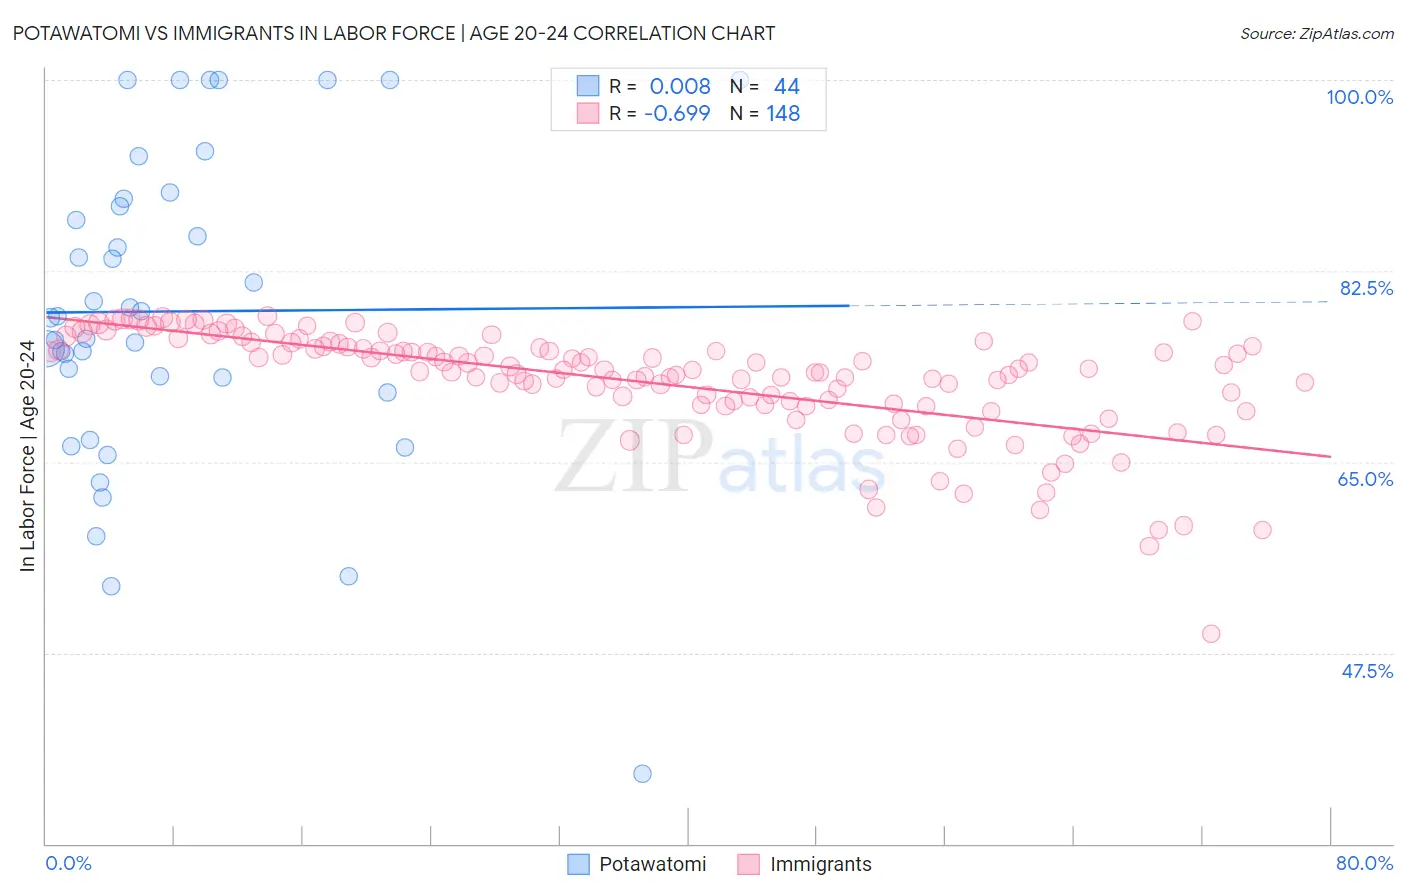
Potawatomi vs Immigrants In Labor Force | Age 20-24 Correlation Chart
The statistical analysis conducted on geographies consisting of 117,717,222 people shows no correlation between the proportion of Potawatomi and labor force participation rate among population between the ages 20 and 24 in the United States with a correlation coefficient (R) of 0.008 and weighted average of 76.2%. Similarly, the statistical analysis conducted on geographies consisting of 576,110,803 people shows a significant negative correlation between the proportion of Immigrants and labor force participation rate among population between the ages 20 and 24 in the United States with a correlation coefficient (R) of -0.699 and weighted average of 74.1%, a difference of 2.8%.
In Labor Force | Age 20-24 Correlation Summary
| Measurement | Potawatomi | Immigrants |
| Minimum | 36.4% | 49.3% |
| Maximum | 100.0% | 78.3% |
| Range | 63.6% | 29.0% |
| Mean | 78.8% | 72.3% |
| Median | 78.3% | 73.4% |
| Interquartile 25% (IQ1) | 72.0% | 70.2% |
| Interquartile 75% (IQ3) | 88.8% | 75.6% |
| Interquartile Range (IQR) | 16.7% | 5.4% |
| Standard Deviation (Sample) | 14.4% | 5.0% |
| Standard Deviation (Population) | 14.2% | 5.0% |
Similar Demographics by In Labor Force | Age 20-24
Demographics Similar to Potawatomi by In Labor Force | Age 20-24
In terms of in labor force | age 20-24, the demographic groups most similar to Potawatomi are Immigrants from Germany (76.2%, a difference of 0.0%), Nonimmigrants (76.2%, a difference of 0.010%), Hungarian (76.3%, a difference of 0.090%), Maltese (76.3%, a difference of 0.11%), and Immigrants from Lithuania (76.1%, a difference of 0.12%).
| Demographics | Rating | Rank | In Labor Force | Age 20-24 |
| Immigrants | Thailand | 99.3 /100 | #87 | Exceptional 76.4% |
| Spanish | 99.2 /100 | #88 | Exceptional 76.4% |
| Bulgarians | 99.2 /100 | #89 | Exceptional 76.4% |
| Immigrants | Burma/Myanmar | 99.1 /100 | #90 | Exceptional 76.3% |
| Sierra Leoneans | 99.0 /100 | #91 | Exceptional 76.3% |
| Maltese | 98.9 /100 | #92 | Exceptional 76.3% |
| Hungarians | 98.9 /100 | #93 | Exceptional 76.3% |
| Potawatomi | 98.5 /100 | #94 | Exceptional 76.2% |
| Immigrants | Germany | 98.5 /100 | #95 | Exceptional 76.2% |
| Immigrants | Nonimmigrants | 98.5 /100 | #96 | Exceptional 76.2% |
| Immigrants | Lithuania | 98.0 /100 | #97 | Exceptional 76.1% |
| Immigrants | Oceania | 98.0 /100 | #98 | Exceptional 76.1% |
| Americans | 97.8 /100 | #99 | Exceptional 76.1% |
| Shoshone | 97.8 /100 | #100 | Exceptional 76.1% |
| Immigrants | Poland | 97.7 /100 | #101 | Exceptional 76.1% |
Demographics Similar to Immigrants by In Labor Force | Age 20-24
In terms of in labor force | age 20-24, the demographic groups most similar to Immigrants are Immigrants from Chile (74.1%, a difference of 0.010%), Laotian (74.1%, a difference of 0.010%), Immigrants from France (74.1%, a difference of 0.030%), Bermudan (74.1%, a difference of 0.040%), and Immigrants from Switzerland (74.2%, a difference of 0.050%).
| Demographics | Rating | Rank | In Labor Force | Age 20-24 |
| Immigrants | Ireland | 5.8 /100 | #227 | Tragic 74.3% |
| Immigrants | Ukraine | 5.1 /100 | #228 | Tragic 74.2% |
| Immigrants | Sweden | 4.6 /100 | #229 | Tragic 74.2% |
| Immigrants | Albania | 4.3 /100 | #230 | Tragic 74.2% |
| Immigrants | Greece | 4.1 /100 | #231 | Tragic 74.2% |
| Immigrants | Switzerland | 4.1 /100 | #232 | Tragic 74.2% |
| Immigrants | Chile | 3.7 /100 | #233 | Tragic 74.1% |
| Immigrants | Immigrants | 3.6 /100 | #234 | Tragic 74.1% |
| Laotians | 3.5 /100 | #235 | Tragic 74.1% |
| Immigrants | France | 3.3 /100 | #236 | Tragic 74.1% |
| Bermudans | 3.2 /100 | #237 | Tragic 74.1% |
| Immigrants | Japan | 3.0 /100 | #238 | Tragic 74.1% |
| Immigrants | Latin America | 2.7 /100 | #239 | Tragic 74.1% |
| Immigrants | Sri Lanka | 2.3 /100 | #240 | Tragic 74.0% |
| Immigrants | Senegal | 2.1 /100 | #241 | Tragic 74.0% |