Potawatomi vs Central American In Labor Force | Age 20-24
COMPARE
Potawatomi
Central American
In Labor Force | Age 20-24
In Labor Force | Age 20-24 Comparison
Potawatomi
Central Americans
76.2%
IN LABOR FORCE | AGE 20-24
98.5/ 100
METRIC RATING
94th/ 347
METRIC RANK
75.0%
IN LABOR FORCE | AGE 20-24
48.7/ 100
METRIC RATING
176th/ 347
METRIC RANK
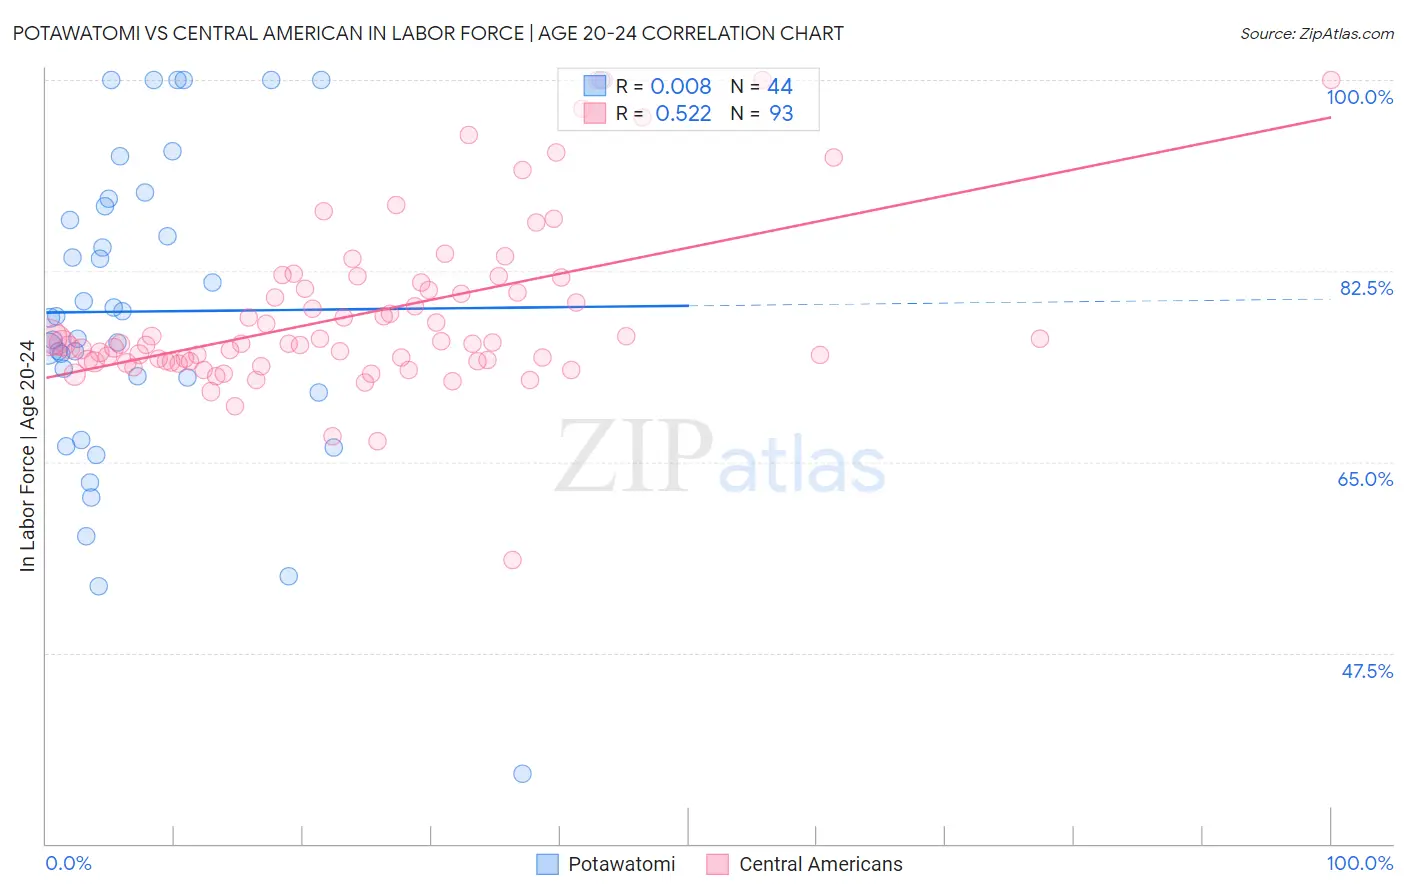
Potawatomi vs Central American In Labor Force | Age 20-24 Correlation Chart
The statistical analysis conducted on geographies consisting of 117,717,222 people shows no correlation between the proportion of Potawatomi and labor force participation rate among population between the ages 20 and 24 in the United States with a correlation coefficient (R) of 0.008 and weighted average of 76.2%. Similarly, the statistical analysis conducted on geographies consisting of 504,332,893 people shows a substantial positive correlation between the proportion of Central Americans and labor force participation rate among population between the ages 20 and 24 in the United States with a correlation coefficient (R) of 0.522 and weighted average of 75.0%, a difference of 1.6%.
In Labor Force | Age 20-24 Correlation Summary
| Measurement | Potawatomi | Central American |
| Minimum | 36.4% | 56.0% |
| Maximum | 100.0% | 100.0% |
| Range | 63.6% | 44.0% |
| Mean | 78.8% | 78.6% |
| Median | 78.3% | 75.8% |
| Interquartile 25% (IQ1) | 72.0% | 74.2% |
| Interquartile 75% (IQ3) | 88.8% | 81.1% |
| Interquartile Range (IQR) | 16.7% | 6.9% |
| Standard Deviation (Sample) | 14.4% | 7.8% |
| Standard Deviation (Population) | 14.2% | 7.8% |
Similar Demographics by In Labor Force | Age 20-24
Demographics Similar to Potawatomi by In Labor Force | Age 20-24
In terms of in labor force | age 20-24, the demographic groups most similar to Potawatomi are Immigrants from Germany (76.2%, a difference of 0.0%), Nonimmigrants (76.2%, a difference of 0.010%), Hungarian (76.3%, a difference of 0.090%), Maltese (76.3%, a difference of 0.11%), and Immigrants from Lithuania (76.1%, a difference of 0.12%).
| Demographics | Rating | Rank | In Labor Force | Age 20-24 |
| Immigrants | Thailand | 99.3 /100 | #87 | Exceptional 76.4% |
| Spanish | 99.2 /100 | #88 | Exceptional 76.4% |
| Bulgarians | 99.2 /100 | #89 | Exceptional 76.4% |
| Immigrants | Burma/Myanmar | 99.1 /100 | #90 | Exceptional 76.3% |
| Sierra Leoneans | 99.0 /100 | #91 | Exceptional 76.3% |
| Maltese | 98.9 /100 | #92 | Exceptional 76.3% |
| Hungarians | 98.9 /100 | #93 | Exceptional 76.3% |
| Potawatomi | 98.5 /100 | #94 | Exceptional 76.2% |
| Immigrants | Germany | 98.5 /100 | #95 | Exceptional 76.2% |
| Immigrants | Nonimmigrants | 98.5 /100 | #96 | Exceptional 76.2% |
| Immigrants | Lithuania | 98.0 /100 | #97 | Exceptional 76.1% |
| Immigrants | Oceania | 98.0 /100 | #98 | Exceptional 76.1% |
| Americans | 97.8 /100 | #99 | Exceptional 76.1% |
| Shoshone | 97.8 /100 | #100 | Exceptional 76.1% |
| Immigrants | Poland | 97.7 /100 | #101 | Exceptional 76.1% |
Demographics Similar to Central Americans by In Labor Force | Age 20-24
In terms of in labor force | age 20-24, the demographic groups most similar to Central Americans are Syrian (75.0%, a difference of 0.010%), Immigrants from Mexico (75.0%, a difference of 0.010%), Immigrants from Croatia (75.1%, a difference of 0.020%), South African (75.0%, a difference of 0.020%), and Yakama (75.1%, a difference of 0.030%).
| Demographics | Rating | Rank | In Labor Force | Age 20-24 |
| Immigrants | Philippines | 55.8 /100 | #169 | Average 75.1% |
| Mexicans | 52.1 /100 | #170 | Average 75.1% |
| Cajuns | 51.1 /100 | #171 | Average 75.1% |
| Yakama | 50.8 /100 | #172 | Average 75.1% |
| Immigrants | Croatia | 50.2 /100 | #173 | Average 75.1% |
| South Africans | 50.0 /100 | #174 | Average 75.0% |
| Syrians | 49.5 /100 | #175 | Average 75.0% |
| Central Americans | 48.7 /100 | #176 | Average 75.0% |
| Immigrants | Mexico | 47.8 /100 | #177 | Average 75.0% |
| Immigrants | Central America | 45.0 /100 | #178 | Average 75.0% |
| Immigrants | Latvia | 44.1 /100 | #179 | Average 75.0% |
| Immigrants | Czechoslovakia | 44.0 /100 | #180 | Average 75.0% |
| Africans | 42.5 /100 | #181 | Average 75.0% |
| Immigrants | South Africa | 36.9 /100 | #182 | Fair 74.9% |
| Immigrants | Costa Rica | 36.7 /100 | #183 | Fair 74.9% |