Portuguese vs Thai In Labor Force | Age > 16
COMPARE
Portuguese
Thai
In Labor Force | Age > 16
In Labor Force | Age > 16 Comparison
Portuguese
Thais
64.4%
IN LABOR FORCE | AGE > 16
1.6/ 100
METRIC RATING
251st/ 347
METRIC RANK
67.2%
IN LABOR FORCE | AGE > 16
100.0/ 100
METRIC RATING
29th/ 347
METRIC RANK
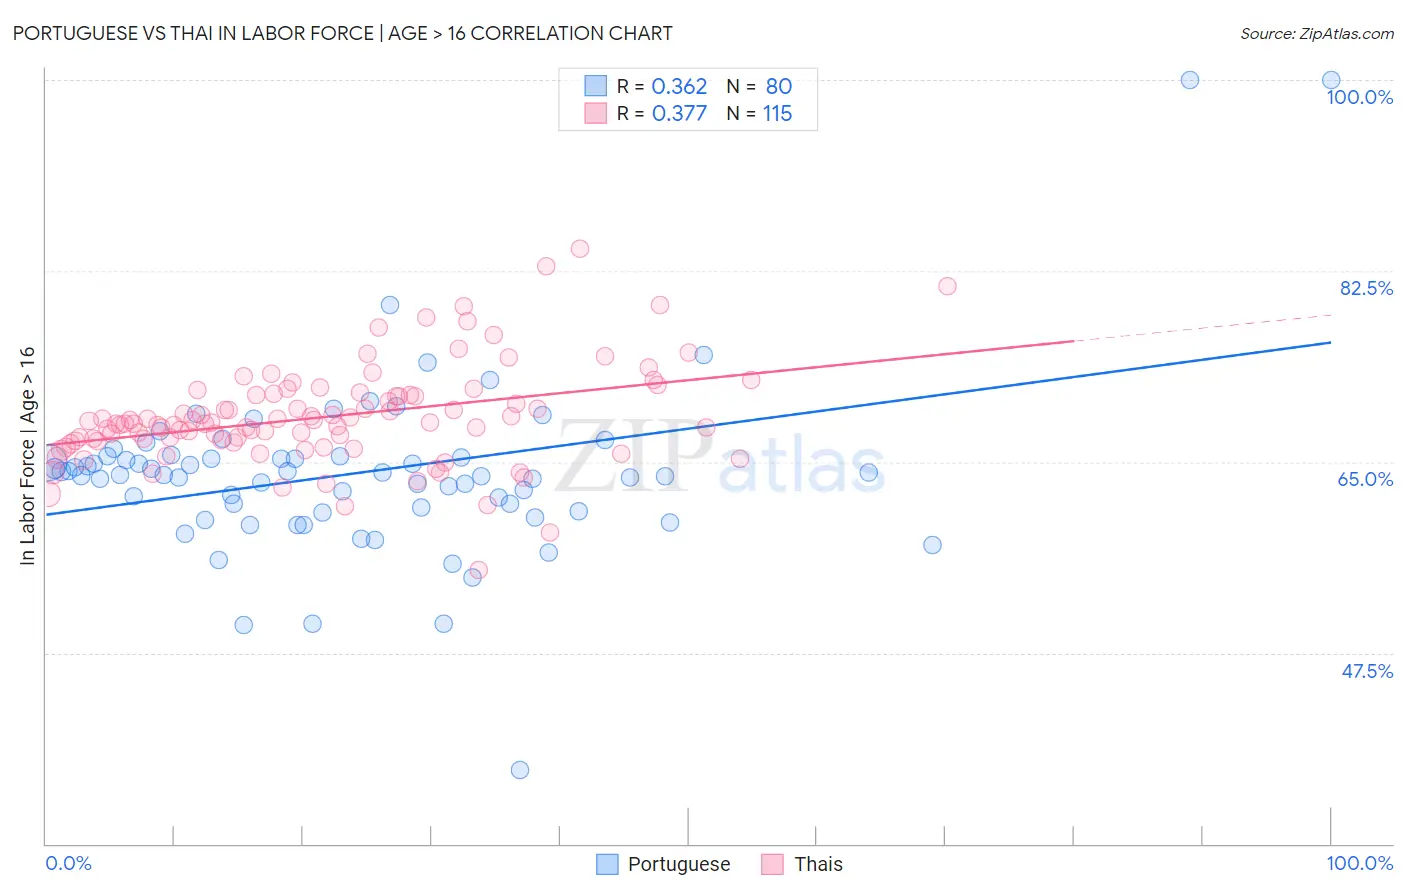
Portuguese vs Thai In Labor Force | Age > 16 Correlation Chart
The statistical analysis conducted on geographies consisting of 450,362,243 people shows a mild positive correlation between the proportion of Portuguese and labor force participation rate among population ages 16 and over in the United States with a correlation coefficient (R) of 0.362 and weighted average of 64.4%. Similarly, the statistical analysis conducted on geographies consisting of 475,904,842 people shows a mild positive correlation between the proportion of Thais and labor force participation rate among population ages 16 and over in the United States with a correlation coefficient (R) of 0.377 and weighted average of 67.2%, a difference of 4.4%.
In Labor Force | Age > 16 Correlation Summary
| Measurement | Portuguese | Thai |
| Minimum | 36.8% | 55.1% |
| Maximum | 100.0% | 84.5% |
| Range | 63.2% | 29.4% |
| Mean | 64.0% | 69.1% |
| Median | 63.8% | 68.5% |
| Interquartile 25% (IQ1) | 60.7% | 66.9% |
| Interquartile 75% (IQ3) | 65.4% | 71.2% |
| Interquartile Range (IQR) | 4.8% | 4.3% |
| Standard Deviation (Sample) | 8.2% | 4.6% |
| Standard Deviation (Population) | 8.2% | 4.5% |
Similar Demographics by In Labor Force | Age > 16
Demographics Similar to Portuguese by In Labor Force | Age > 16
In terms of in labor force | age > 16, the demographic groups most similar to Portuguese are British West Indian (64.4%, a difference of 0.020%), German (64.4%, a difference of 0.030%), Immigrants from Dominican Republic (64.4%, a difference of 0.030%), Czechoslovakian (64.3%, a difference of 0.040%), and Immigrants from Uzbekistan (64.3%, a difference of 0.040%).
| Demographics | Rating | Rank | In Labor Force | Age > 16 |
| Tsimshian | 3.1 /100 | #244 | Tragic 64.5% |
| West Indians | 3.0 /100 | #245 | Tragic 64.5% |
| Immigrants | Caribbean | 2.3 /100 | #246 | Tragic 64.4% |
| Swiss | 2.1 /100 | #247 | Tragic 64.4% |
| Immigrants | Barbados | 2.1 /100 | #248 | Tragic 64.4% |
| Germans | 1.8 /100 | #249 | Tragic 64.4% |
| British West Indians | 1.8 /100 | #250 | Tragic 64.4% |
| Portuguese | 1.6 /100 | #251 | Tragic 64.4% |
| Immigrants | Dominican Republic | 1.5 /100 | #252 | Tragic 64.4% |
| Czechoslovakians | 1.4 /100 | #253 | Tragic 64.3% |
| Immigrants | Uzbekistan | 1.4 /100 | #254 | Tragic 64.3% |
| Hispanics or Latinos | 1.1 /100 | #255 | Tragic 64.3% |
| Immigrants | Mexico | 1.0 /100 | #256 | Tragic 64.3% |
| Inupiat | 0.8 /100 | #257 | Tragic 64.3% |
| Immigrants | Scotland | 0.8 /100 | #258 | Tragic 64.2% |
Demographics Similar to Thais by In Labor Force | Age > 16
In terms of in labor force | age > 16, the demographic groups most similar to Thais are Immigrants from Zaire (67.2%, a difference of 0.010%), Immigrants from Morocco (67.2%, a difference of 0.040%), Ghanaian (67.1%, a difference of 0.11%), Zimbabwean (67.3%, a difference of 0.12%), and Immigrants from Congo (67.1%, a difference of 0.16%).
| Demographics | Rating | Rank | In Labor Force | Age > 16 |
| Immigrants | Uganda | 100.0 /100 | #22 | Exceptional 67.5% |
| Cambodians | 100.0 /100 | #23 | Exceptional 67.4% |
| Ugandans | 100.0 /100 | #24 | Exceptional 67.4% |
| Immigrants | Africa | 100.0 /100 | #25 | Exceptional 67.4% |
| Immigrants | Cabo Verde | 100.0 /100 | #26 | Exceptional 67.3% |
| Zimbabweans | 100.0 /100 | #27 | Exceptional 67.3% |
| Immigrants | Morocco | 100.0 /100 | #28 | Exceptional 67.2% |
| Thais | 100.0 /100 | #29 | Exceptional 67.2% |
| Immigrants | Zaire | 100.0 /100 | #30 | Exceptional 67.2% |
| Ghanaians | 100.0 /100 | #31 | Exceptional 67.1% |
| Immigrants | Congo | 100.0 /100 | #32 | Exceptional 67.1% |
| Afghans | 100.0 /100 | #33 | Exceptional 67.1% |
| Immigrants | Ghana | 100.0 /100 | #34 | Exceptional 67.1% |
| Immigrants | South Central Asia | 100.0 /100 | #35 | Exceptional 67.1% |
| Immigrants | Western Africa | 100.0 /100 | #36 | Exceptional 67.1% |