Lithuanian vs Thai In Labor Force | Age > 16

COMPARE

Lithuanian
Race
Ancestry
AfghanAfricanAlaska NativeAlaskan AthabascanAlbanianAleutAlsatianAmericanApacheArabArapahoArgentineanArmenianAssyrian/Chaldean/SyriacAustralianAustrianBahamianBangladeshiBarbadianBasqueBelgianBelizeanBermudanBhutaneseBlackfeetBolivianBrazilianBritishBritish West IndianBulgarianBurmeseCajunCambodianCanadianCape VerdeanCarpatho RusynCelticCentral AmericanCentral American IndianCherokeeCheyenneChickasawChileanChineseChippewaChoctawColombianColvilleComancheCosta RicanCreeCreekCroatianCrowCubanCypriotCzechCzechoslovakianDanishDelawareDominicanDutchDutch West IndianEastern EuropeanEcuadorianEgyptianEnglishEstonianEthiopianEuropeanFijianFilipinoFinnishFrenchFrench American IndianFrench CanadianGermanGerman RussianGhanaianGreekGuamanian/ChamorroGuatemalanGuyaneseHaitianHmongHonduranHopiHoumaHungarianIcelanderIndian (Asian)IndonesianInupiatIranianIraqiIrishIroquoisIsraeliItalianJamaicanJapaneseJordanianKenyanKiowaKoreanLaotianLatvianLebaneseLiberianLithuanianLumbeeLuxembourgerMacedonianMalaysianMalteseMarshalleseMenomineeMexicanMexican American IndianMongolianMoroccanNative HawaiianNavajoNepaleseNew ZealanderNicaraguanNigerianNorthern EuropeanNorwegianOkinawanOsageOttawaPaiutePakistaniPalestinianPanamanianParaguayanPennsylvania GermanPeruvianPimaPolishPortuguesePotawatomiPuebloPuerto RicanPuget Sound SalishRomanianRussianSalvadoranSamoanScandinavianScotch-IrishScottishSeminoleSenegaleseSerbianShoshoneSierra LeoneanSiouxSlavicSlovakSloveneSomaliSouth AfricanSouth AmericanSouth American IndianSoviet UnionSpaniardSpanishSpanish AmericanSpanish American IndianSri LankanSubsaharan AfricanSudaneseSwedishSwissSyrianTaiwaneseTlingit-HaidaTohono O'OdhamTonganTrinidadian and TobagonianTsimshianTurkishU.S. Virgin IslanderUgandanUkrainianUruguayanUteVenezuelanVietnameseWelshWest IndianYakamaYaquiYugoslavianYumanYup'ikZimbabwean
Immigration
NonimmigrantsImmigrantsAfghanistanAfricaAlbaniaArgentinaArmeniaAsiaAustraliaAustriaBahamasBangladeshBarbadosBelarusBelgiumBelizeBoliviaBosnia and HerzegovinaBrazilBulgariaBurma/MyanmarCabo VerdeCambodiaCameroonCanadaCaribbeanCentral AmericaChileChinaColombiaCongoCosta RicaCroatiaCubaCzechoslovakiaDenmarkDominicaDominican RepublicEastern AfricaEastern AsiaEastern EuropeEcuadorEgyptEl SalvadorEnglandEritreaEthiopiaEuropeFijiFranceGermanyGhanaGreeceGrenadaGuatemalaGuyanaHaitiHondurasHong KongHungaryIndiaIndonesiaIranIraqIrelandIsraelItalyJamaicaJapanJordanKazakhstanKenyaKoreaKuwaitLaosLatin AmericaLatviaLebanonLiberiaLithuaniaMalaysiaMexicoMicronesiaMiddle AfricaMoldovaMoroccoNepalNetherlandsNicaraguaNigeriaNorth AmericaNorth MacedoniaNorthern AfricaNorthern EuropeNorwayOceaniaPakistanPanamaPeruPhilippinesPolandPortugalRomaniaRussiaSaudi ArabiaScotlandSenegalSerbiaSierra LeoneSingaporeSomaliaSouth AfricaSouth AmericaSouth Central AsiaSouth Eastern AsiaSouthern EuropeSpainSri LankaSt. Vincent and the GrenadinesSudanSwedenSwitzerlandSyriaTaiwanThailandTrinidad and TobagoTurkeyUgandaUkraineUruguayUzbekistanVenezuelaVietnamWest IndiesWestern AfricaWestern AsiaWestern EuropeYemenZaireZimbabweAzores
Thai
Race
Ancestry
AfghanAfricanAlaska NativeAlaskan AthabascanAlbanianAleutAlsatianAmericanApacheArabArapahoArgentineanArmenianAssyrian/Chaldean/SyriacAustralianAustrianBahamianBangladeshiBarbadianBasqueBelgianBelizeanBermudanBhutaneseBlackfeetBolivianBrazilianBritishBritish West IndianBulgarianBurmeseCajunCambodianCanadianCape VerdeanCarpatho RusynCelticCentral AmericanCentral American IndianCherokeeCheyenneChickasawChileanChineseChippewaChoctawColombianColvilleComancheCosta RicanCreeCreekCroatianCrowCubanCypriotCzechCzechoslovakianDanishDelawareDominicanDutchDutch West IndianEastern EuropeanEcuadorianEgyptianEnglishEstonianEthiopianEuropeanFijianFilipinoFinnishFrenchFrench American IndianFrench CanadianGermanGerman RussianGhanaianGreekGuamanian/ChamorroGuatemalanGuyaneseHaitianHmongHonduranHopiHoumaHungarianIcelanderIndian (Asian)IndonesianInupiatIranianIraqiIrishIroquoisIsraeliItalianJamaicanJapaneseJordanianKenyanKiowaKoreanLaotianLatvianLebaneseLiberianLumbeeLuxembourgerMacedonianMalaysianMalteseMarshalleseMenomineeMexicanMexican American IndianMongolianMoroccanNative HawaiianNavajoNepaleseNew ZealanderNicaraguanNigerianNorthern EuropeanNorwegianOkinawanOsageOttawaPaiutePakistaniPalestinianPanamanianParaguayanPennsylvania GermanPeruvianPimaPolishPortuguesePotawatomiPuebloPuerto RicanPuget Sound SalishRomanianRussianSalvadoranSamoanScandinavianScotch-IrishScottishSeminoleSenegaleseSerbianShoshoneSierra LeoneanSiouxSlavicSlovakSloveneSomaliSouth AfricanSouth AmericanSouth American IndianSoviet UnionSpaniardSpanishSpanish AmericanSpanish American IndianSri LankanSubsaharan AfricanSudaneseSwedishSwissSyrianTaiwaneseThaiTlingit-HaidaTohono O'OdhamTonganTrinidadian and TobagonianTsimshianTurkishU.S. Virgin IslanderUgandanUkrainianUruguayanUteVenezuelanVietnameseWelshWest IndianYakamaYaquiYugoslavianYumanYup'ikZimbabwean
Immigration
NonimmigrantsImmigrantsAfghanistanAfricaAlbaniaArgentinaArmeniaAsiaAustraliaAustriaBahamasBangladeshBarbadosBelarusBelgiumBelizeBoliviaBosnia and HerzegovinaBrazilBulgariaBurma/MyanmarCabo VerdeCambodiaCameroonCanadaCaribbeanCentral AmericaChileChinaColombiaCongoCosta RicaCroatiaCubaCzechoslovakiaDenmarkDominicaDominican RepublicEastern AfricaEastern AsiaEastern EuropeEcuadorEgyptEl SalvadorEnglandEritreaEthiopiaEuropeFijiFranceGermanyGhanaGreeceGrenadaGuatemalaGuyanaHaitiHondurasHong KongHungaryIndiaIndonesiaIranIraqIrelandIsraelItalyJamaicaJapanJordanKazakhstanKenyaKoreaKuwaitLaosLatin AmericaLatviaLebanonLiberiaLithuaniaMalaysiaMexicoMicronesiaMiddle AfricaMoldovaMoroccoNepalNetherlandsNicaraguaNigeriaNorth AmericaNorth MacedoniaNorthern AfricaNorthern EuropeNorwayOceaniaPakistanPanamaPeruPhilippinesPolandPortugalRomaniaRussiaSaudi ArabiaScotlandSenegalSerbiaSierra LeoneSingaporeSomaliaSouth AfricaSouth AmericaSouth Central AsiaSouth Eastern AsiaSouthern EuropeSpainSri LankaSt. Vincent and the GrenadinesSudanSwedenSwitzerlandSyriaTaiwanThailandTrinidad and TobagoTurkeyUgandaUkraineUruguayUzbekistanVenezuelaVietnamWest IndiesWestern AfricaWestern AsiaWestern EuropeYemenZaireZimbabweAzores
In Labor Force | Age > 16
Income
Poverty
Unemployment
Labor Participation
Family Structure
Vehicle Availability
Education Level
Disability

In Labor Force | Age > 16 Comparison

Lithuanians

Thais

Poor
Exceptional
64.8%
IN LABOR FORCE | AGE > 16
17.4/ 100
METRIC RATING
206th/ 347
METRIC RANK
67.2%
IN LABOR FORCE | AGE > 16
100.0/ 100
METRIC RATING
29th/ 347
METRIC RANK

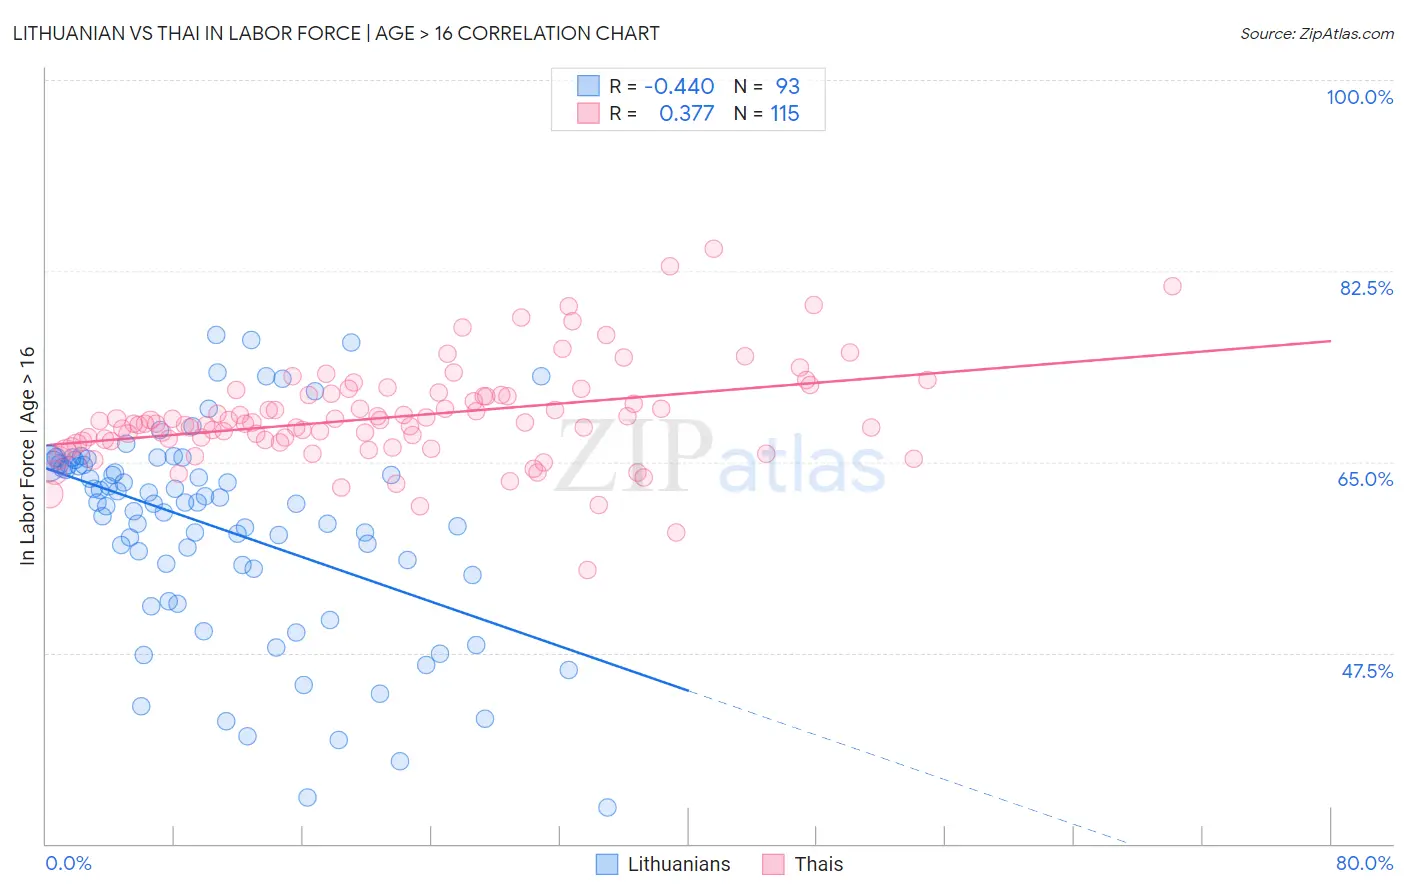
Lithuanian vs Thai In Labor Force | Age > 16 Correlation Chart

The statistical analysis conducted on geographies consisting of 421,961,459 people shows a moderate negative correlation between the proportion of Lithuanians and labor force participation rate among population ages 16 and over in the United States with a correlation coefficient (R) of -0.440 and weighted average of 64.8%. Similarly, the statistical analysis conducted on geographies consisting of 475,904,842 people shows a mild positive correlation between the proportion of Thais and labor force participation rate among population ages 16 and over in the United States with a correlation coefficient (R) of 0.377 and weighted average of 67.2%, a difference of 3.7%.
Lithuanian vs Thai In Labor Force | Age > 16

In Labor Force | Age > 16 Correlation Summary

MeasurementLithuanianThai
Minimum33.3%55.1%
Maximum76.6%84.5%
Range43.3%29.4%
Mean59.0%69.1%
Median61.2%68.5%
Interquartile 25% (IQ1)54.9%66.9%
Interquartile 75% (IQ3)64.8%71.2%
Interquartile Range (IQR)9.9%4.3%
Standard Deviation (Sample)9.4%4.6%
Standard Deviation (Population)9.4%4.5%

Similar Demographics by In Labor Force | Age > 16

Demographics Similar to Lithuanians by In Labor Force | Age > 16

In terms of in labor force | age > 16, the demographic groups most similar to Lithuanians are Immigrants from Latin America (64.8%, a difference of 0.020%), Belizean (64.8%, a difference of 0.020%), Russian (64.9%, a difference of 0.030%), Slovene (64.9%, a difference of 0.030%), and Jamaican (64.9%, a difference of 0.030%).
DemographicsRating | RankIn Labor Force | Age > 16
Mexican American Indians
23.1
/100
|
#199
Fair
64.9%
Armenians
20.2
/100
|
#200
Fair
64.9%
Ukrainians
19.6
/100
|
#201
Poor
64.9%
Immigrants | Belgium
19.4
/100
|
#202
Poor
64.9%
Russians
18.8
/100
|
#203
Poor
64.9%
Slovenes
18.7
/100
|
#204
Poor
64.9%
Jamaicans
18.7
/100
|
#205
Poor
64.9%
Lithuanians
17.4
/100
|
#206
Poor
64.8%
Immigrants | Latin America
16.4
/100
|
#207
Poor
64.8%
Belizeans
16.2
/100
|
#208
Poor
64.8%
Immigrants | Trinidad and Tobago
15.6
/100
|
#209
Poor
64.8%
Immigrants | Denmark
14.7
/100
|
#210
Poor
64.8%
Fijians
14.1
/100
|
#211
Poor
64.8%
Alaskan Athabascans
13.9
/100
|
#212
Poor
64.8%
Maltese
13.8
/100
|
#213
Poor
64.8%

Demographics Similar to Thais by In Labor Force | Age > 16

In terms of in labor force | age > 16, the demographic groups most similar to Thais are Immigrants from Zaire (67.2%, a difference of 0.010%), Immigrants from Morocco (67.2%, a difference of 0.040%), Ghanaian (67.1%, a difference of 0.11%), Zimbabwean (67.3%, a difference of 0.12%), and Immigrants from Congo (67.1%, a difference of 0.16%).
DemographicsRating | RankIn Labor Force | Age > 16
Immigrants | Uganda
100.0
/100
|
#22
Exceptional
67.5%
Cambodians
100.0
/100
|
#23
Exceptional
67.4%
Ugandans
100.0
/100
|
#24
Exceptional
67.4%
Immigrants | Africa
100.0
/100
|
#25
Exceptional
67.4%
Immigrants | Cabo Verde
100.0
/100
|
#26
Exceptional
67.3%
Zimbabweans
100.0
/100
|
#27
Exceptional
67.3%
Immigrants | Morocco
100.0
/100
|
#28
Exceptional
67.2%
Thais
100.0
/100
|
#29
Exceptional
67.2%
Immigrants | Zaire
100.0
/100
|
#30
Exceptional
67.2%
Ghanaians
100.0
/100
|
#31
Exceptional
67.1%
Immigrants | Congo
100.0
/100
|
#32
Exceptional
67.1%
Afghans
100.0
/100
|
#33
Exceptional
67.1%
Immigrants | Ghana
100.0
/100
|
#34
Exceptional
67.1%
Immigrants | South Central Asia
100.0
/100
|
#35
Exceptional
67.1%
Immigrants | Western Africa
100.0
/100
|
#36
Exceptional
67.1%