Portuguese vs Native/Alaskan In Labor Force | Age > 16
COMPARE
Portuguese
Native/Alaskan
In Labor Force | Age > 16
In Labor Force | Age > 16 Comparison
Portuguese
Natives/Alaskans
64.4%
IN LABOR FORCE | AGE > 16
1.6/ 100
METRIC RATING
251st/ 347
METRIC RANK
60.6%
IN LABOR FORCE | AGE > 16
0.0/ 100
METRIC RATING
335th/ 347
METRIC RANK
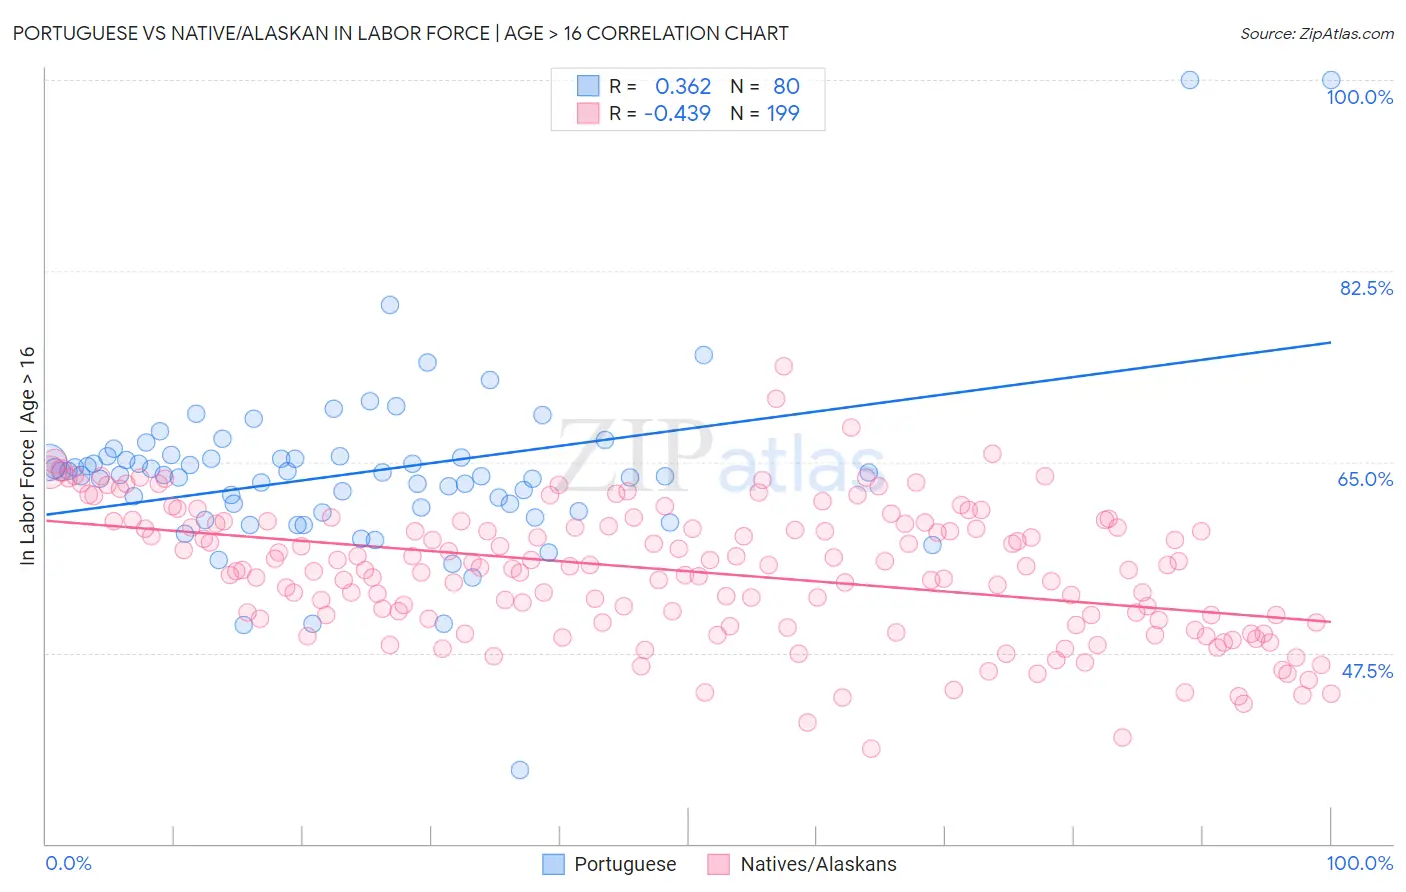
Portuguese vs Native/Alaskan In Labor Force | Age > 16 Correlation Chart
The statistical analysis conducted on geographies consisting of 450,362,243 people shows a mild positive correlation between the proportion of Portuguese and labor force participation rate among population ages 16 and over in the United States with a correlation coefficient (R) of 0.362 and weighted average of 64.4%. Similarly, the statistical analysis conducted on geographies consisting of 513,032,279 people shows a moderate negative correlation between the proportion of Natives/Alaskans and labor force participation rate among population ages 16 and over in the United States with a correlation coefficient (R) of -0.439 and weighted average of 60.6%, a difference of 6.2%.
In Labor Force | Age > 16 Correlation Summary
| Measurement | Portuguese | Native/Alaskan |
| Minimum | 36.8% | 38.7% |
| Maximum | 100.0% | 73.8% |
| Range | 63.2% | 35.1% |
| Mean | 64.0% | 55.0% |
| Median | 63.8% | 55.3% |
| Interquartile 25% (IQ1) | 60.7% | 50.5% |
| Interquartile 75% (IQ3) | 65.4% | 59.3% |
| Interquartile Range (IQR) | 4.8% | 8.9% |
| Standard Deviation (Sample) | 8.2% | 6.1% |
| Standard Deviation (Population) | 8.2% | 6.1% |
Similar Demographics by In Labor Force | Age > 16
Demographics Similar to Portuguese by In Labor Force | Age > 16
In terms of in labor force | age > 16, the demographic groups most similar to Portuguese are British West Indian (64.4%, a difference of 0.020%), German (64.4%, a difference of 0.030%), Immigrants from Dominican Republic (64.4%, a difference of 0.030%), Czechoslovakian (64.3%, a difference of 0.040%), and Immigrants from Uzbekistan (64.3%, a difference of 0.040%).
| Demographics | Rating | Rank | In Labor Force | Age > 16 |
| Tsimshian | 3.1 /100 | #244 | Tragic 64.5% |
| West Indians | 3.0 /100 | #245 | Tragic 64.5% |
| Immigrants | Caribbean | 2.3 /100 | #246 | Tragic 64.4% |
| Swiss | 2.1 /100 | #247 | Tragic 64.4% |
| Immigrants | Barbados | 2.1 /100 | #248 | Tragic 64.4% |
| Germans | 1.8 /100 | #249 | Tragic 64.4% |
| British West Indians | 1.8 /100 | #250 | Tragic 64.4% |
| Portuguese | 1.6 /100 | #251 | Tragic 64.4% |
| Immigrants | Dominican Republic | 1.5 /100 | #252 | Tragic 64.4% |
| Czechoslovakians | 1.4 /100 | #253 | Tragic 64.3% |
| Immigrants | Uzbekistan | 1.4 /100 | #254 | Tragic 64.3% |
| Hispanics or Latinos | 1.1 /100 | #255 | Tragic 64.3% |
| Immigrants | Mexico | 1.0 /100 | #256 | Tragic 64.3% |
| Inupiat | 0.8 /100 | #257 | Tragic 64.3% |
| Immigrants | Scotland | 0.8 /100 | #258 | Tragic 64.2% |
Demographics Similar to Natives/Alaskans by In Labor Force | Age > 16
In terms of in labor force | age > 16, the demographic groups most similar to Natives/Alaskans are Menominee (60.6%, a difference of 0.020%), Apache (60.7%, a difference of 0.19%), Paiute (60.7%, a difference of 0.23%), Crow (60.8%, a difference of 0.31%), and Ute (60.9%, a difference of 0.49%).
| Demographics | Rating | Rank | In Labor Force | Age > 16 |
| Dutch West Indians | 0.0 /100 | #328 | Tragic 61.7% |
| Choctaw | 0.0 /100 | #329 | Tragic 61.5% |
| Creek | 0.0 /100 | #330 | Tragic 61.3% |
| Ute | 0.0 /100 | #331 | Tragic 60.9% |
| Crow | 0.0 /100 | #332 | Tragic 60.8% |
| Paiute | 0.0 /100 | #333 | Tragic 60.7% |
| Apache | 0.0 /100 | #334 | Tragic 60.7% |
| Natives/Alaskans | 0.0 /100 | #335 | Tragic 60.6% |
| Menominee | 0.0 /100 | #336 | Tragic 60.6% |
| Colville | 0.0 /100 | #337 | Tragic 59.8% |
| Immigrants | Yemen | 0.0 /100 | #338 | Tragic 59.6% |
| Houma | 0.0 /100 | #339 | Tragic 59.5% |
| Pueblo | 0.0 /100 | #340 | Tragic 59.3% |
| Hopi | 0.0 /100 | #341 | Tragic 58.4% |
| Puerto Ricans | 0.0 /100 | #342 | Tragic 58.1% |