Portuguese vs Immigrants from Morocco In Labor Force | Age 20-64
COMPARE
Portuguese
Immigrants from Morocco
In Labor Force | Age 20-64
In Labor Force | Age 20-64 Comparison
Portuguese
Immigrants from Morocco
79.1%
IN LABOR FORCE | AGE 20-64
6.4/ 100
METRIC RATING
225th/ 347
METRIC RANK
80.8%
IN LABOR FORCE | AGE 20-64
100.0/ 100
METRIC RATING
24th/ 347
METRIC RANK
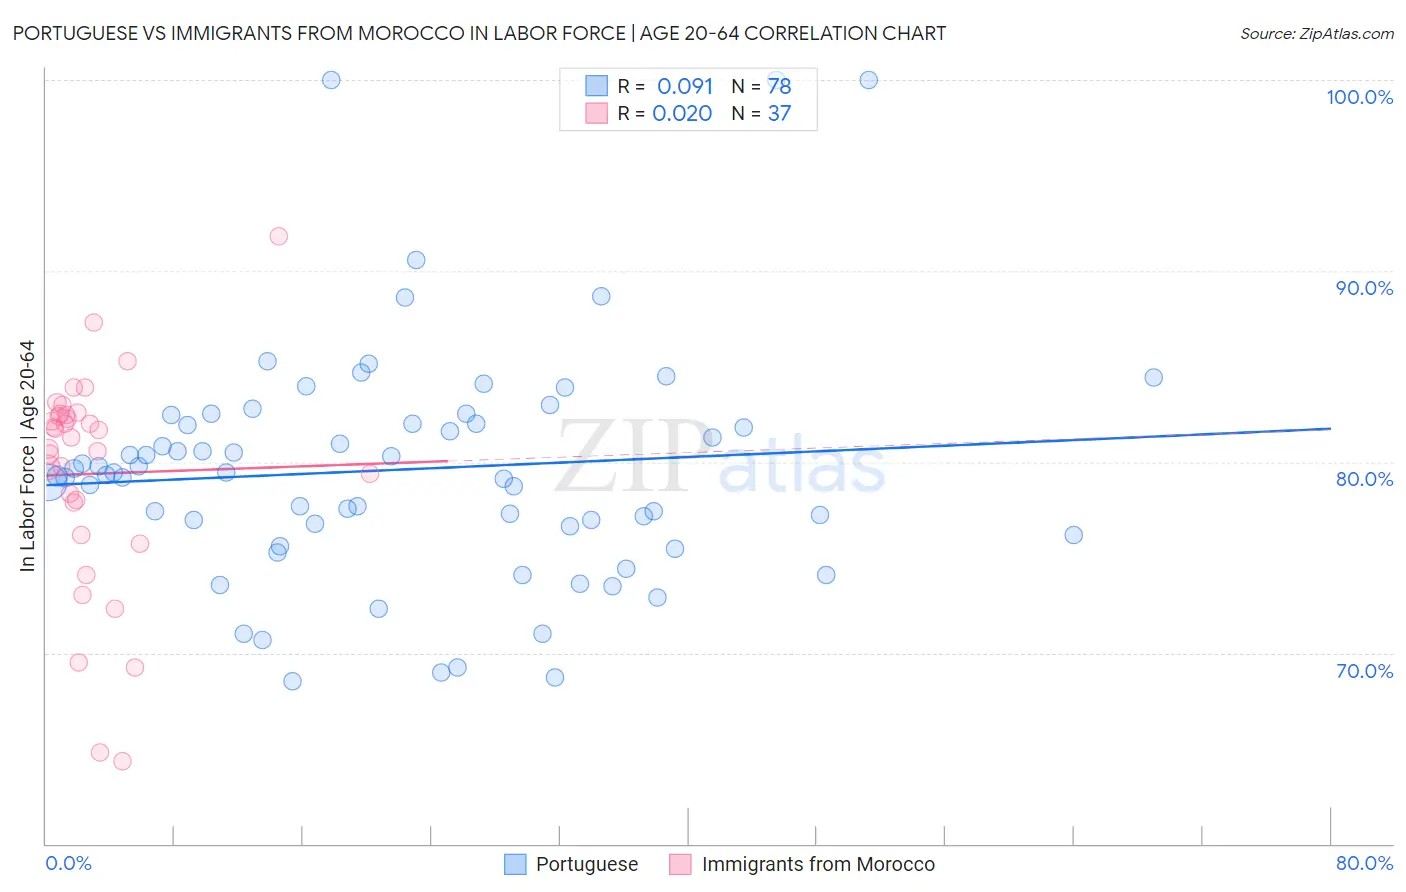
Portuguese vs Immigrants from Morocco In Labor Force | Age 20-64 Correlation Chart
The statistical analysis conducted on geographies consisting of 450,360,065 people shows a slight positive correlation between the proportion of Portuguese and labor force participation rate among population between the ages 20 and 64 in the United States with a correlation coefficient (R) of 0.091 and weighted average of 79.1%. Similarly, the statistical analysis conducted on geographies consisting of 178,912,438 people shows no correlation between the proportion of Immigrants from Morocco and labor force participation rate among population between the ages 20 and 64 in the United States with a correlation coefficient (R) of 0.020 and weighted average of 80.8%, a difference of 2.1%.
In Labor Force | Age 20-64 Correlation Summary
| Measurement | Portuguese | Immigrants from Morocco |
| Minimum | 68.5% | 64.3% |
| Maximum | 100.0% | 91.8% |
| Range | 31.5% | 27.5% |
| Mean | 79.6% | 79.4% |
| Median | 79.4% | 81.2% |
| Interquartile 25% (IQ1) | 76.7% | 77.0% |
| Interquartile 75% (IQ3) | 82.0% | 82.5% |
| Interquartile Range (IQR) | 5.3% | 5.5% |
| Standard Deviation (Sample) | 6.2% | 5.8% |
| Standard Deviation (Population) | 6.1% | 5.7% |
Similar Demographics by In Labor Force | Age 20-64
Demographics Similar to Portuguese by In Labor Force | Age 20-64
In terms of in labor force | age 20-64, the demographic groups most similar to Portuguese are Immigrants from Uzbekistan (79.1%, a difference of 0.010%), Immigrants from Panama (79.1%, a difference of 0.020%), Canadian (79.1%, a difference of 0.020%), Central American (79.1%, a difference of 0.020%), and Immigrants from Western Europe (79.1%, a difference of 0.020%).
| Demographics | Rating | Rank | In Labor Force | Age 20-64 |
| Immigrants | England | 9.3 /100 | #218 | Tragic 79.2% |
| French Canadians | 8.4 /100 | #219 | Tragic 79.2% |
| Immigrants | Immigrants | 7.7 /100 | #220 | Tragic 79.2% |
| Hungarians | 7.2 /100 | #221 | Tragic 79.2% |
| Immigrants | Panama | 6.9 /100 | #222 | Tragic 79.1% |
| Canadians | 6.8 /100 | #223 | Tragic 79.1% |
| Immigrants | Uzbekistan | 6.8 /100 | #224 | Tragic 79.1% |
| Portuguese | 6.4 /100 | #225 | Tragic 79.1% |
| Central Americans | 5.9 /100 | #226 | Tragic 79.1% |
| Immigrants | Western Europe | 5.9 /100 | #227 | Tragic 79.1% |
| Panamanians | 5.7 /100 | #228 | Tragic 79.1% |
| Alsatians | 5.7 /100 | #229 | Tragic 79.1% |
| Native Hawaiians | 5.6 /100 | #230 | Tragic 79.1% |
| Lebanese | 5.1 /100 | #231 | Tragic 79.1% |
| Guamanians/Chamorros | 4.5 /100 | #232 | Tragic 79.1% |
Demographics Similar to Immigrants from Morocco by In Labor Force | Age 20-64
In terms of in labor force | age 20-64, the demographic groups most similar to Immigrants from Morocco are Immigrants from Bosnia and Herzegovina (80.8%, a difference of 0.010%), Kenyan (80.8%, a difference of 0.010%), Sudanese (80.8%, a difference of 0.020%), Immigrants from Serbia (80.8%, a difference of 0.030%), and Liberian (80.9%, a difference of 0.090%).
| Demographics | Rating | Rank | In Labor Force | Age 20-64 |
| Norwegians | 100.0 /100 | #17 | Exceptional 81.0% |
| Immigrants | Bulgaria | 100.0 /100 | #18 | Exceptional 81.0% |
| Zimbabweans | 100.0 /100 | #19 | Exceptional 81.0% |
| Thais | 100.0 /100 | #20 | Exceptional 80.9% |
| Liberians | 100.0 /100 | #21 | Exceptional 80.9% |
| Sudanese | 100.0 /100 | #22 | Exceptional 80.8% |
| Immigrants | Bosnia and Herzegovina | 100.0 /100 | #23 | Exceptional 80.8% |
| Immigrants | Morocco | 100.0 /100 | #24 | Exceptional 80.8% |
| Kenyans | 100.0 /100 | #25 | Exceptional 80.8% |
| Immigrants | Serbia | 100.0 /100 | #26 | Exceptional 80.8% |
| Immigrants | Kenya | 99.9 /100 | #27 | Exceptional 80.7% |
| Immigrants | Uganda | 99.9 /100 | #28 | Exceptional 80.7% |
| Immigrants | South Central Asia | 99.9 /100 | #29 | Exceptional 80.7% |
| Immigrants | North Macedonia | 99.9 /100 | #30 | Exceptional 80.7% |
| Immigrants | Lithuania | 99.9 /100 | #31 | Exceptional 80.7% |