Immigrants from Eastern Asia vs Immigrants from Morocco In Labor Force | Age 20-64
COMPARE
Immigrants from Eastern Asia
Immigrants from Morocco
In Labor Force | Age 20-64
In Labor Force | Age 20-64 Comparison
Immigrants from Eastern Asia
Immigrants from Morocco
79.9%
IN LABOR FORCE | AGE 20-64
89.4/ 100
METRIC RATING
128th/ 347
METRIC RANK
80.8%
IN LABOR FORCE | AGE 20-64
100.0/ 100
METRIC RATING
24th/ 347
METRIC RANK
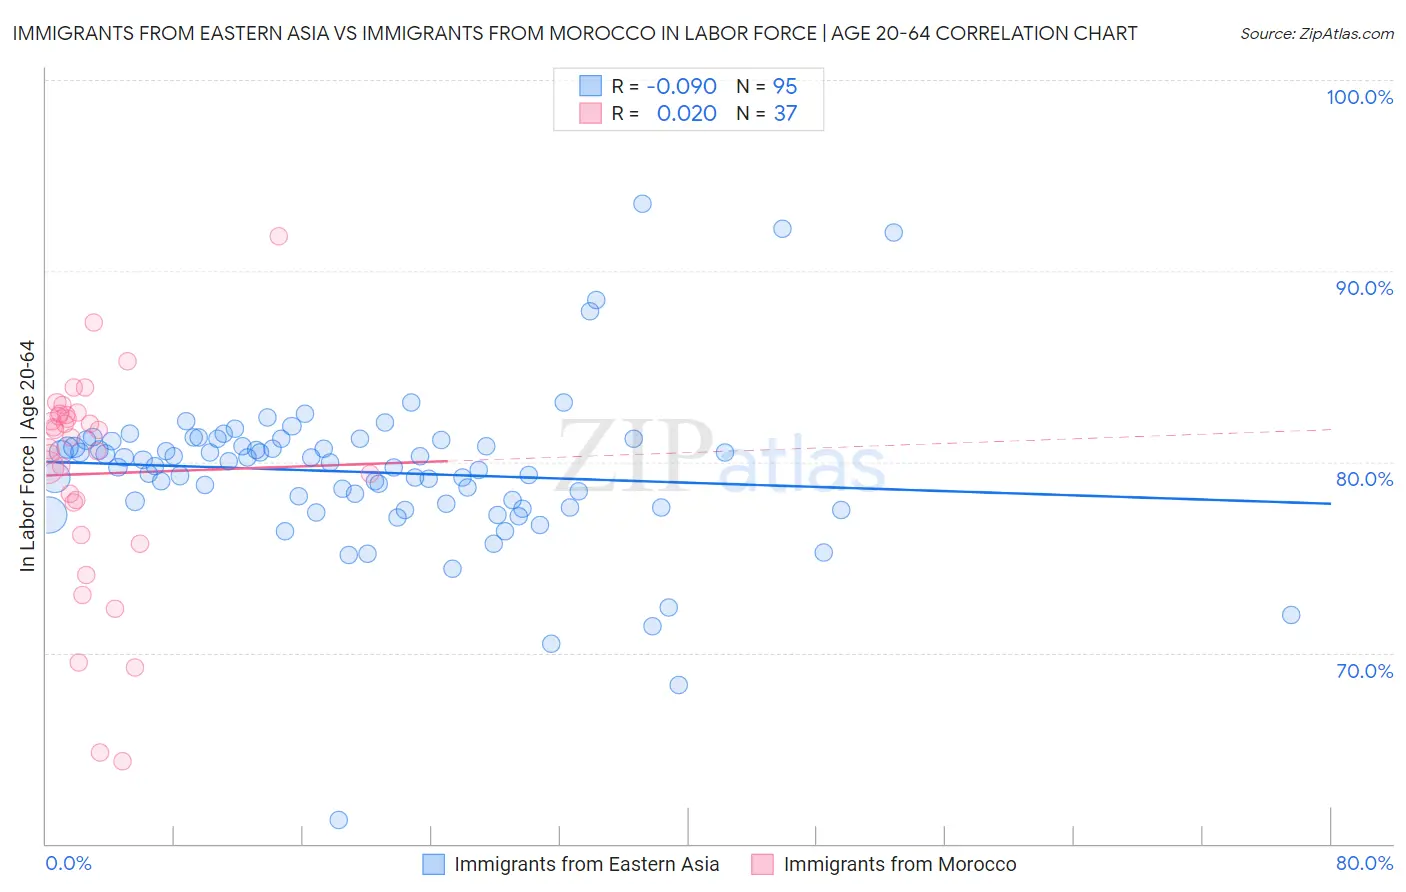
Immigrants from Eastern Asia vs Immigrants from Morocco In Labor Force | Age 20-64 Correlation Chart
The statistical analysis conducted on geographies consisting of 499,970,956 people shows a slight negative correlation between the proportion of Immigrants from Eastern Asia and labor force participation rate among population between the ages 20 and 64 in the United States with a correlation coefficient (R) of -0.090 and weighted average of 79.9%. Similarly, the statistical analysis conducted on geographies consisting of 178,912,438 people shows no correlation between the proportion of Immigrants from Morocco and labor force participation rate among population between the ages 20 and 64 in the United States with a correlation coefficient (R) of 0.020 and weighted average of 80.8%, a difference of 1.2%.
In Labor Force | Age 20-64 Correlation Summary
| Measurement | Immigrants from Eastern Asia | Immigrants from Morocco |
| Minimum | 61.2% | 64.3% |
| Maximum | 93.5% | 91.8% |
| Range | 32.3% | 27.5% |
| Mean | 79.5% | 79.4% |
| Median | 80.0% | 81.2% |
| Interquartile 25% (IQ1) | 77.6% | 77.0% |
| Interquartile 75% (IQ3) | 81.1% | 82.5% |
| Interquartile Range (IQR) | 3.5% | 5.5% |
| Standard Deviation (Sample) | 4.2% | 5.8% |
| Standard Deviation (Population) | 4.2% | 5.7% |
Similar Demographics by In Labor Force | Age 20-64
Demographics Similar to Immigrants from Eastern Asia by In Labor Force | Age 20-64
In terms of in labor force | age 20-64, the demographic groups most similar to Immigrants from Eastern Asia are Immigrants from Czechoslovakia (79.9%, a difference of 0.010%), Italian (79.9%, a difference of 0.010%), Immigrants from Zaire (79.9%, a difference of 0.020%), Immigrants from Iran (79.9%, a difference of 0.020%), and Immigrants from France (79.9%, a difference of 0.030%).
| Demographics | Rating | Rank | In Labor Force | Age 20-64 |
| Immigrants | Kuwait | 92.2 /100 | #121 | Exceptional 80.0% |
| Mongolians | 92.0 /100 | #122 | Exceptional 79.9% |
| Immigrants | Russia | 91.8 /100 | #123 | Exceptional 79.9% |
| Immigrants | Europe | 91.6 /100 | #124 | Exceptional 79.9% |
| Danes | 91.5 /100 | #125 | Exceptional 79.9% |
| Immigrants | France | 90.7 /100 | #126 | Exceptional 79.9% |
| Immigrants | Czechoslovakia | 89.7 /100 | #127 | Excellent 79.9% |
| Immigrants | Eastern Asia | 89.4 /100 | #128 | Excellent 79.9% |
| Italians | 88.9 /100 | #129 | Excellent 79.9% |
| Immigrants | Zaire | 88.6 /100 | #130 | Excellent 79.9% |
| Immigrants | Iran | 88.3 /100 | #131 | Excellent 79.9% |
| Indians (Asian) | 87.7 /100 | #132 | Excellent 79.9% |
| South American Indians | 87.6 /100 | #133 | Excellent 79.9% |
| Belgians | 87.4 /100 | #134 | Excellent 79.9% |
| Ukrainians | 86.8 /100 | #135 | Excellent 79.9% |
Demographics Similar to Immigrants from Morocco by In Labor Force | Age 20-64
In terms of in labor force | age 20-64, the demographic groups most similar to Immigrants from Morocco are Immigrants from Bosnia and Herzegovina (80.8%, a difference of 0.010%), Kenyan (80.8%, a difference of 0.010%), Sudanese (80.8%, a difference of 0.020%), Immigrants from Serbia (80.8%, a difference of 0.030%), and Liberian (80.9%, a difference of 0.090%).
| Demographics | Rating | Rank | In Labor Force | Age 20-64 |
| Norwegians | 100.0 /100 | #17 | Exceptional 81.0% |
| Immigrants | Bulgaria | 100.0 /100 | #18 | Exceptional 81.0% |
| Zimbabweans | 100.0 /100 | #19 | Exceptional 81.0% |
| Thais | 100.0 /100 | #20 | Exceptional 80.9% |
| Liberians | 100.0 /100 | #21 | Exceptional 80.9% |
| Sudanese | 100.0 /100 | #22 | Exceptional 80.8% |
| Immigrants | Bosnia and Herzegovina | 100.0 /100 | #23 | Exceptional 80.8% |
| Immigrants | Morocco | 100.0 /100 | #24 | Exceptional 80.8% |
| Kenyans | 100.0 /100 | #25 | Exceptional 80.8% |
| Immigrants | Serbia | 100.0 /100 | #26 | Exceptional 80.8% |
| Immigrants | Kenya | 99.9 /100 | #27 | Exceptional 80.7% |
| Immigrants | Uganda | 99.9 /100 | #28 | Exceptional 80.7% |
| Immigrants | South Central Asia | 99.9 /100 | #29 | Exceptional 80.7% |
| Immigrants | North Macedonia | 99.9 /100 | #30 | Exceptional 80.7% |
| Immigrants | Lithuania | 99.9 /100 | #31 | Exceptional 80.7% |