Portuguese vs Immigrants from Turkey In Labor Force | Age 20-64
COMPARE
Portuguese
Immigrants from Turkey
In Labor Force | Age 20-64
In Labor Force | Age 20-64 Comparison
Portuguese
Immigrants from Turkey
79.1%
IN LABOR FORCE | AGE 20-64
6.4/ 100
METRIC RATING
225th/ 347
METRIC RANK
80.2%
IN LABOR FORCE | AGE 20-64
98.5/ 100
METRIC RATING
70th/ 347
METRIC RANK
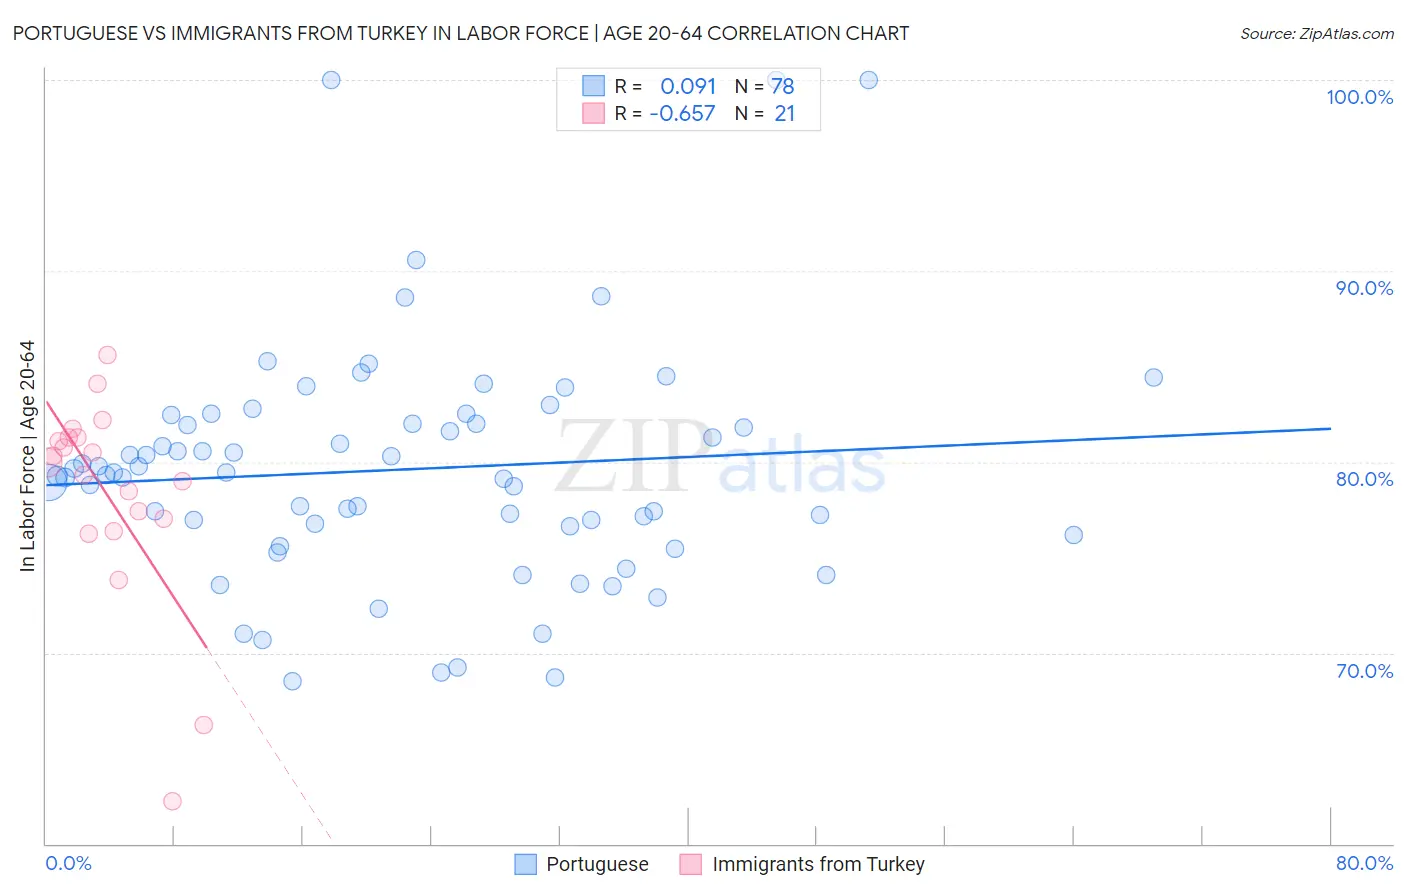
Portuguese vs Immigrants from Turkey In Labor Force | Age 20-64 Correlation Chart
The statistical analysis conducted on geographies consisting of 450,360,065 people shows a slight positive correlation between the proportion of Portuguese and labor force participation rate among population between the ages 20 and 64 in the United States with a correlation coefficient (R) of 0.091 and weighted average of 79.1%. Similarly, the statistical analysis conducted on geographies consisting of 223,052,749 people shows a significant negative correlation between the proportion of Immigrants from Turkey and labor force participation rate among population between the ages 20 and 64 in the United States with a correlation coefficient (R) of -0.657 and weighted average of 80.2%, a difference of 1.4%.
In Labor Force | Age 20-64 Correlation Summary
| Measurement | Portuguese | Immigrants from Turkey |
| Minimum | 68.5% | 62.2% |
| Maximum | 100.0% | 85.6% |
| Range | 31.5% | 23.4% |
| Mean | 79.6% | 78.3% |
| Median | 79.4% | 80.0% |
| Interquartile 25% (IQ1) | 76.7% | 76.7% |
| Interquartile 75% (IQ3) | 82.0% | 81.3% |
| Interquartile Range (IQR) | 5.3% | 4.6% |
| Standard Deviation (Sample) | 6.2% | 5.5% |
| Standard Deviation (Population) | 6.1% | 5.3% |
Similar Demographics by In Labor Force | Age 20-64
Demographics Similar to Portuguese by In Labor Force | Age 20-64
In terms of in labor force | age 20-64, the demographic groups most similar to Portuguese are Immigrants from Uzbekistan (79.1%, a difference of 0.010%), Immigrants from Panama (79.1%, a difference of 0.020%), Canadian (79.1%, a difference of 0.020%), Central American (79.1%, a difference of 0.020%), and Immigrants from Western Europe (79.1%, a difference of 0.020%).
| Demographics | Rating | Rank | In Labor Force | Age 20-64 |
| Immigrants | England | 9.3 /100 | #218 | Tragic 79.2% |
| French Canadians | 8.4 /100 | #219 | Tragic 79.2% |
| Immigrants | Immigrants | 7.7 /100 | #220 | Tragic 79.2% |
| Hungarians | 7.2 /100 | #221 | Tragic 79.2% |
| Immigrants | Panama | 6.9 /100 | #222 | Tragic 79.1% |
| Canadians | 6.8 /100 | #223 | Tragic 79.1% |
| Immigrants | Uzbekistan | 6.8 /100 | #224 | Tragic 79.1% |
| Portuguese | 6.4 /100 | #225 | Tragic 79.1% |
| Central Americans | 5.9 /100 | #226 | Tragic 79.1% |
| Immigrants | Western Europe | 5.9 /100 | #227 | Tragic 79.1% |
| Panamanians | 5.7 /100 | #228 | Tragic 79.1% |
| Alsatians | 5.7 /100 | #229 | Tragic 79.1% |
| Native Hawaiians | 5.6 /100 | #230 | Tragic 79.1% |
| Lebanese | 5.1 /100 | #231 | Tragic 79.1% |
| Guamanians/Chamorros | 4.5 /100 | #232 | Tragic 79.1% |
Demographics Similar to Immigrants from Turkey by In Labor Force | Age 20-64
In terms of in labor force | age 20-64, the demographic groups most similar to Immigrants from Turkey are Bhutanese (80.2%, a difference of 0.0%), Albanian (80.2%, a difference of 0.0%), Taiwanese (80.2%, a difference of 0.010%), Soviet Union (80.2%, a difference of 0.010%), and Lithuanian (80.2%, a difference of 0.020%).
| Demographics | Rating | Rank | In Labor Force | Age 20-64 |
| Immigrants | Korea | 98.8 /100 | #63 | Exceptional 80.3% |
| Immigrants | Albania | 98.7 /100 | #64 | Exceptional 80.3% |
| Lithuanians | 98.7 /100 | #65 | Exceptional 80.2% |
| Macedonians | 98.7 /100 | #66 | Exceptional 80.2% |
| Taiwanese | 98.6 /100 | #67 | Exceptional 80.2% |
| Bhutanese | 98.6 /100 | #68 | Exceptional 80.2% |
| Albanians | 98.6 /100 | #69 | Exceptional 80.2% |
| Immigrants | Turkey | 98.5 /100 | #70 | Exceptional 80.2% |
| Soviet Union | 98.5 /100 | #71 | Exceptional 80.2% |
| Eastern Europeans | 98.4 /100 | #72 | Exceptional 80.2% |
| Cypriots | 98.2 /100 | #73 | Exceptional 80.2% |
| Immigrants | Eastern Europe | 98.1 /100 | #74 | Exceptional 80.2% |
| Immigrants | Afghanistan | 97.9 /100 | #75 | Exceptional 80.2% |
| Egyptians | 97.8 /100 | #76 | Exceptional 80.2% |
| Immigrants | Colombia | 97.8 /100 | #77 | Exceptional 80.2% |