Immigrants from China vs Immigrants from Morocco In Labor Force | Age 20-64
COMPARE
Immigrants from China
Immigrants from Morocco
In Labor Force | Age 20-64
In Labor Force | Age 20-64 Comparison
Immigrants from China
Immigrants from Morocco
79.7%
IN LABOR FORCE | AGE 20-64
69.1/ 100
METRIC RATING
157th/ 347
METRIC RANK
80.8%
IN LABOR FORCE | AGE 20-64
100.0/ 100
METRIC RATING
24th/ 347
METRIC RANK
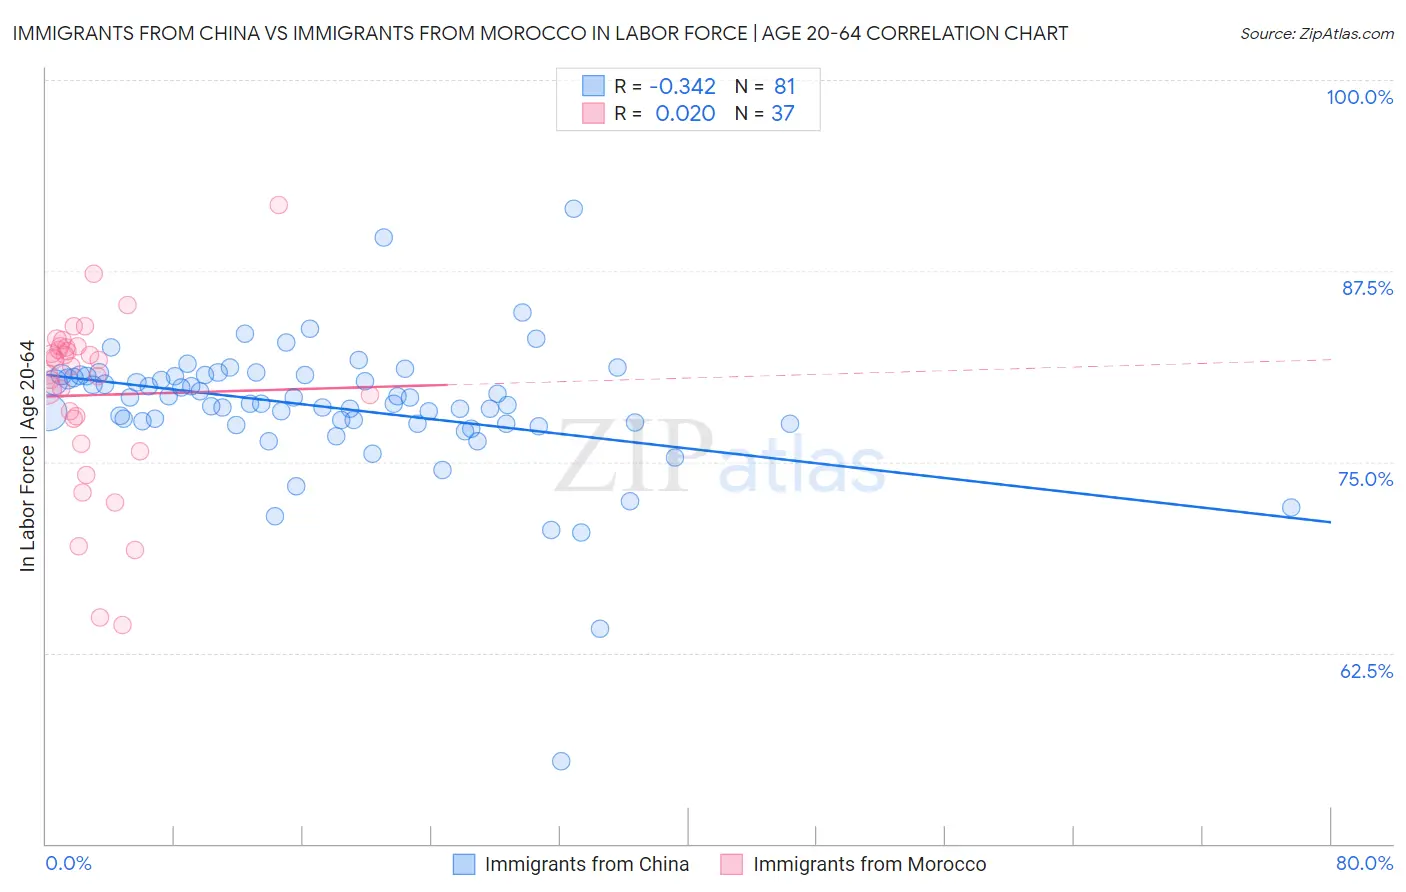
Immigrants from China vs Immigrants from Morocco In Labor Force | Age 20-64 Correlation Chart
The statistical analysis conducted on geographies consisting of 457,119,637 people shows a mild negative correlation between the proportion of Immigrants from China and labor force participation rate among population between the ages 20 and 64 in the United States with a correlation coefficient (R) of -0.342 and weighted average of 79.7%. Similarly, the statistical analysis conducted on geographies consisting of 178,912,438 people shows no correlation between the proportion of Immigrants from Morocco and labor force participation rate among population between the ages 20 and 64 in the United States with a correlation coefficient (R) of 0.020 and weighted average of 80.8%, a difference of 1.4%.
In Labor Force | Age 20-64 Correlation Summary
| Measurement | Immigrants from China | Immigrants from Morocco |
| Minimum | 55.4% | 64.3% |
| Maximum | 91.6% | 91.8% |
| Range | 36.2% | 27.5% |
| Mean | 78.6% | 79.4% |
| Median | 78.8% | 81.2% |
| Interquartile 25% (IQ1) | 77.5% | 77.0% |
| Interquartile 75% (IQ3) | 80.7% | 82.5% |
| Interquartile Range (IQR) | 3.2% | 5.5% |
| Standard Deviation (Sample) | 4.5% | 5.8% |
| Standard Deviation (Population) | 4.5% | 5.7% |
Similar Demographics by In Labor Force | Age 20-64
Demographics Similar to Immigrants from China by In Labor Force | Age 20-64
In terms of in labor force | age 20-64, the demographic groups most similar to Immigrants from China are Immigrants from Kazakhstan (79.7%, a difference of 0.0%), New Zealander (79.7%, a difference of 0.0%), Immigrants from South Africa (79.7%, a difference of 0.0%), Senegalese (79.7%, a difference of 0.0%), and Austrian (79.7%, a difference of 0.010%).
| Demographics | Rating | Rank | In Labor Force | Age 20-64 |
| Costa Ricans | 72.4 /100 | #150 | Good 79.7% |
| Scandinavians | 72.0 /100 | #151 | Good 79.7% |
| Immigrants | Northern Europe | 72.0 /100 | #152 | Good 79.7% |
| Immigrants | Kazakhstan | 69.5 /100 | #153 | Good 79.7% |
| New Zealanders | 69.4 /100 | #154 | Good 79.7% |
| Immigrants | South Africa | 69.2 /100 | #155 | Good 79.7% |
| Senegalese | 69.1 /100 | #156 | Good 79.7% |
| Immigrants | China | 69.1 /100 | #157 | Good 79.7% |
| Austrians | 67.6 /100 | #158 | Good 79.7% |
| Immigrants | Cuba | 66.7 /100 | #159 | Good 79.7% |
| Moroccans | 66.7 /100 | #160 | Good 79.7% |
| South Africans | 66.2 /100 | #161 | Good 79.7% |
| Germans | 65.2 /100 | #162 | Good 79.7% |
| Immigrants | Costa Rica | 64.6 /100 | #163 | Good 79.7% |
| Immigrants | Burma/Myanmar | 64.4 /100 | #164 | Good 79.7% |
Demographics Similar to Immigrants from Morocco by In Labor Force | Age 20-64
In terms of in labor force | age 20-64, the demographic groups most similar to Immigrants from Morocco are Immigrants from Bosnia and Herzegovina (80.8%, a difference of 0.010%), Kenyan (80.8%, a difference of 0.010%), Sudanese (80.8%, a difference of 0.020%), Immigrants from Serbia (80.8%, a difference of 0.030%), and Liberian (80.9%, a difference of 0.090%).
| Demographics | Rating | Rank | In Labor Force | Age 20-64 |
| Norwegians | 100.0 /100 | #17 | Exceptional 81.0% |
| Immigrants | Bulgaria | 100.0 /100 | #18 | Exceptional 81.0% |
| Zimbabweans | 100.0 /100 | #19 | Exceptional 81.0% |
| Thais | 100.0 /100 | #20 | Exceptional 80.9% |
| Liberians | 100.0 /100 | #21 | Exceptional 80.9% |
| Sudanese | 100.0 /100 | #22 | Exceptional 80.8% |
| Immigrants | Bosnia and Herzegovina | 100.0 /100 | #23 | Exceptional 80.8% |
| Immigrants | Morocco | 100.0 /100 | #24 | Exceptional 80.8% |
| Kenyans | 100.0 /100 | #25 | Exceptional 80.8% |
| Immigrants | Serbia | 100.0 /100 | #26 | Exceptional 80.8% |
| Immigrants | Kenya | 99.9 /100 | #27 | Exceptional 80.7% |
| Immigrants | Uganda | 99.9 /100 | #28 | Exceptional 80.7% |
| Immigrants | South Central Asia | 99.9 /100 | #29 | Exceptional 80.7% |
| Immigrants | North Macedonia | 99.9 /100 | #30 | Exceptional 80.7% |
| Immigrants | Lithuania | 99.9 /100 | #31 | Exceptional 80.7% |