Portuguese vs Immigrants from Norway In Labor Force | Age 20-64
COMPARE
Portuguese
Immigrants from Norway
In Labor Force | Age 20-64
In Labor Force | Age 20-64 Comparison
Portuguese
Immigrants from Norway
79.1%
IN LABOR FORCE | AGE 20-64
6.4/ 100
METRIC RATING
225th/ 347
METRIC RANK
79.2%
IN LABOR FORCE | AGE 20-64
12.0/ 100
METRIC RATING
215th/ 347
METRIC RANK
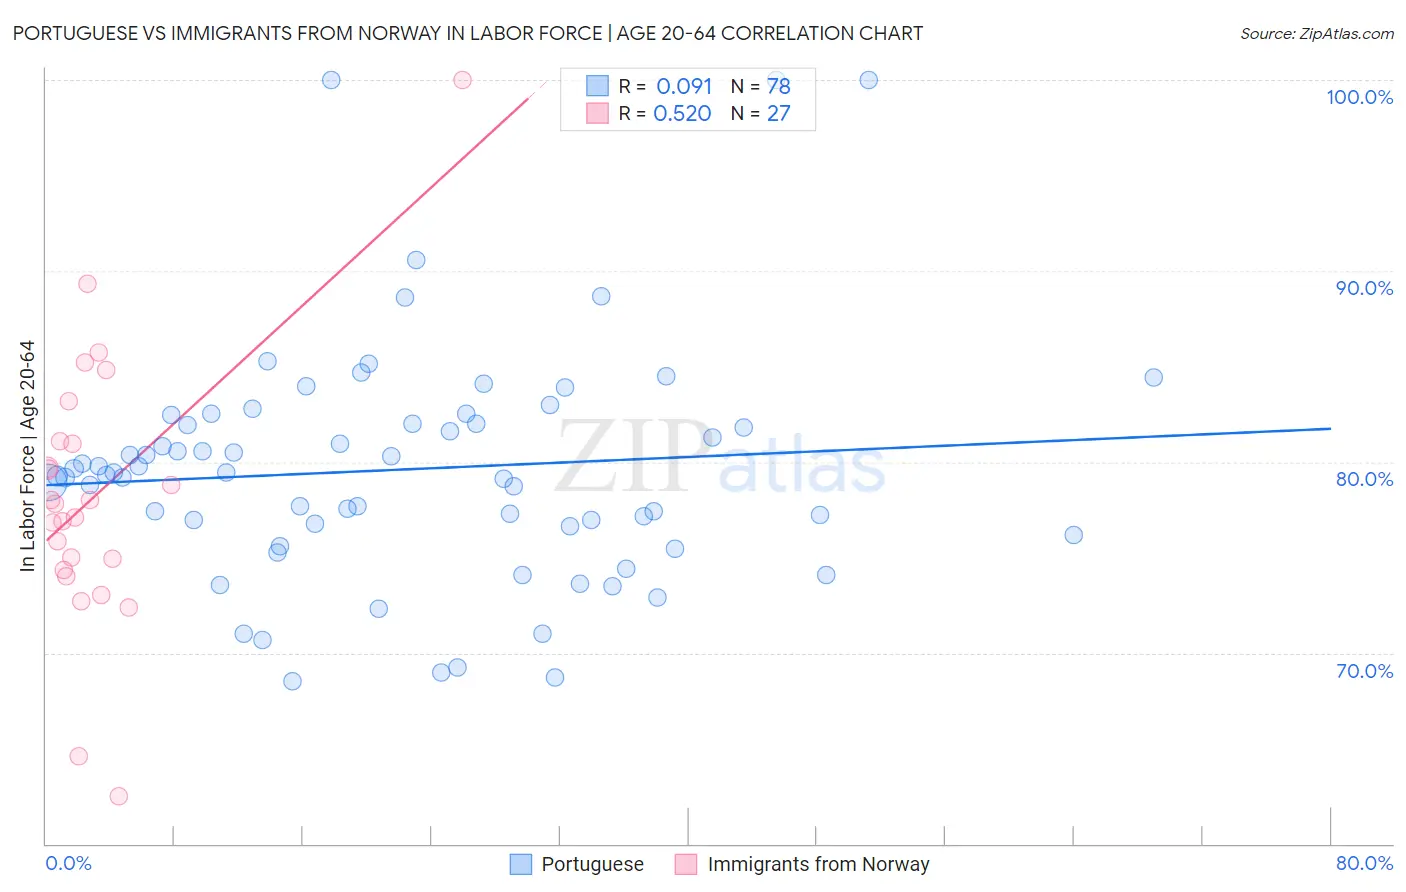
Portuguese vs Immigrants from Norway In Labor Force | Age 20-64 Correlation Chart
The statistical analysis conducted on geographies consisting of 450,360,065 people shows a slight positive correlation between the proportion of Portuguese and labor force participation rate among population between the ages 20 and 64 in the United States with a correlation coefficient (R) of 0.091 and weighted average of 79.1%. Similarly, the statistical analysis conducted on geographies consisting of 116,716,898 people shows a substantial positive correlation between the proportion of Immigrants from Norway and labor force participation rate among population between the ages 20 and 64 in the United States with a correlation coefficient (R) of 0.520 and weighted average of 79.2%, a difference of 0.14%.
In Labor Force | Age 20-64 Correlation Summary
| Measurement | Portuguese | Immigrants from Norway |
| Minimum | 68.5% | 62.5% |
| Maximum | 100.0% | 100.0% |
| Range | 31.5% | 37.5% |
| Mean | 79.6% | 78.2% |
| Median | 79.4% | 77.8% |
| Interquartile 25% (IQ1) | 76.7% | 74.3% |
| Interquartile 75% (IQ3) | 82.0% | 81.1% |
| Interquartile Range (IQR) | 5.3% | 6.7% |
| Standard Deviation (Sample) | 6.2% | 7.3% |
| Standard Deviation (Population) | 6.1% | 7.1% |
Demographics Similar to Portuguese and Immigrants from Norway by In Labor Force | Age 20-64
In terms of in labor force | age 20-64, the demographic groups most similar to Portuguese are Immigrants from Uzbekistan (79.1%, a difference of 0.010%), Immigrants from Panama (79.1%, a difference of 0.020%), Canadian (79.1%, a difference of 0.020%), Central American (79.1%, a difference of 0.020%), and Immigrants from Western Europe (79.1%, a difference of 0.020%). Similarly, the demographic groups most similar to Immigrants from Norway are Immigrants from Armenia (79.2%, a difference of 0.0%), Arab (79.2%, a difference of 0.010%), Irish (79.3%, a difference of 0.020%), Immigrants from Portugal (79.3%, a difference of 0.020%), and Immigrants from Western Asia (79.2%, a difference of 0.020%).
| Demographics | Rating | Rank | In Labor Force | Age 20-64 |
| Haitians | 16.1 /100 | #210 | Poor 79.3% |
| Europeans | 15.3 /100 | #211 | Poor 79.3% |
| Irish | 13.2 /100 | #212 | Poor 79.3% |
| Immigrants | Portugal | 12.8 /100 | #213 | Poor 79.3% |
| Immigrants | Armenia | 12.2 /100 | #214 | Poor 79.2% |
| Immigrants | Norway | 12.0 /100 | #215 | Poor 79.2% |
| Arabs | 11.4 /100 | #216 | Poor 79.2% |
| Immigrants | Western Asia | 11.0 /100 | #217 | Poor 79.2% |
| Immigrants | England | 9.3 /100 | #218 | Tragic 79.2% |
| French Canadians | 8.4 /100 | #219 | Tragic 79.2% |
| Immigrants | Immigrants | 7.7 /100 | #220 | Tragic 79.2% |
| Hungarians | 7.2 /100 | #221 | Tragic 79.2% |
| Immigrants | Panama | 6.9 /100 | #222 | Tragic 79.1% |
| Canadians | 6.8 /100 | #223 | Tragic 79.1% |
| Immigrants | Uzbekistan | 6.8 /100 | #224 | Tragic 79.1% |
| Portuguese | 6.4 /100 | #225 | Tragic 79.1% |
| Central Americans | 5.9 /100 | #226 | Tragic 79.1% |
| Immigrants | Western Europe | 5.9 /100 | #227 | Tragic 79.1% |
| Panamanians | 5.7 /100 | #228 | Tragic 79.1% |
| Alsatians | 5.7 /100 | #229 | Tragic 79.1% |
| Native Hawaiians | 5.6 /100 | #230 | Tragic 79.1% |