Portuguese vs Bahamian In Labor Force | Age 20-64
COMPARE
Portuguese
Bahamian
In Labor Force | Age 20-64
In Labor Force | Age 20-64 Comparison
Portuguese
Bahamians
79.1%
IN LABOR FORCE | AGE 20-64
6.4/ 100
METRIC RATING
225th/ 347
METRIC RANK
78.4%
IN LABOR FORCE | AGE 20-64
0.1/ 100
METRIC RATING
266th/ 347
METRIC RANK
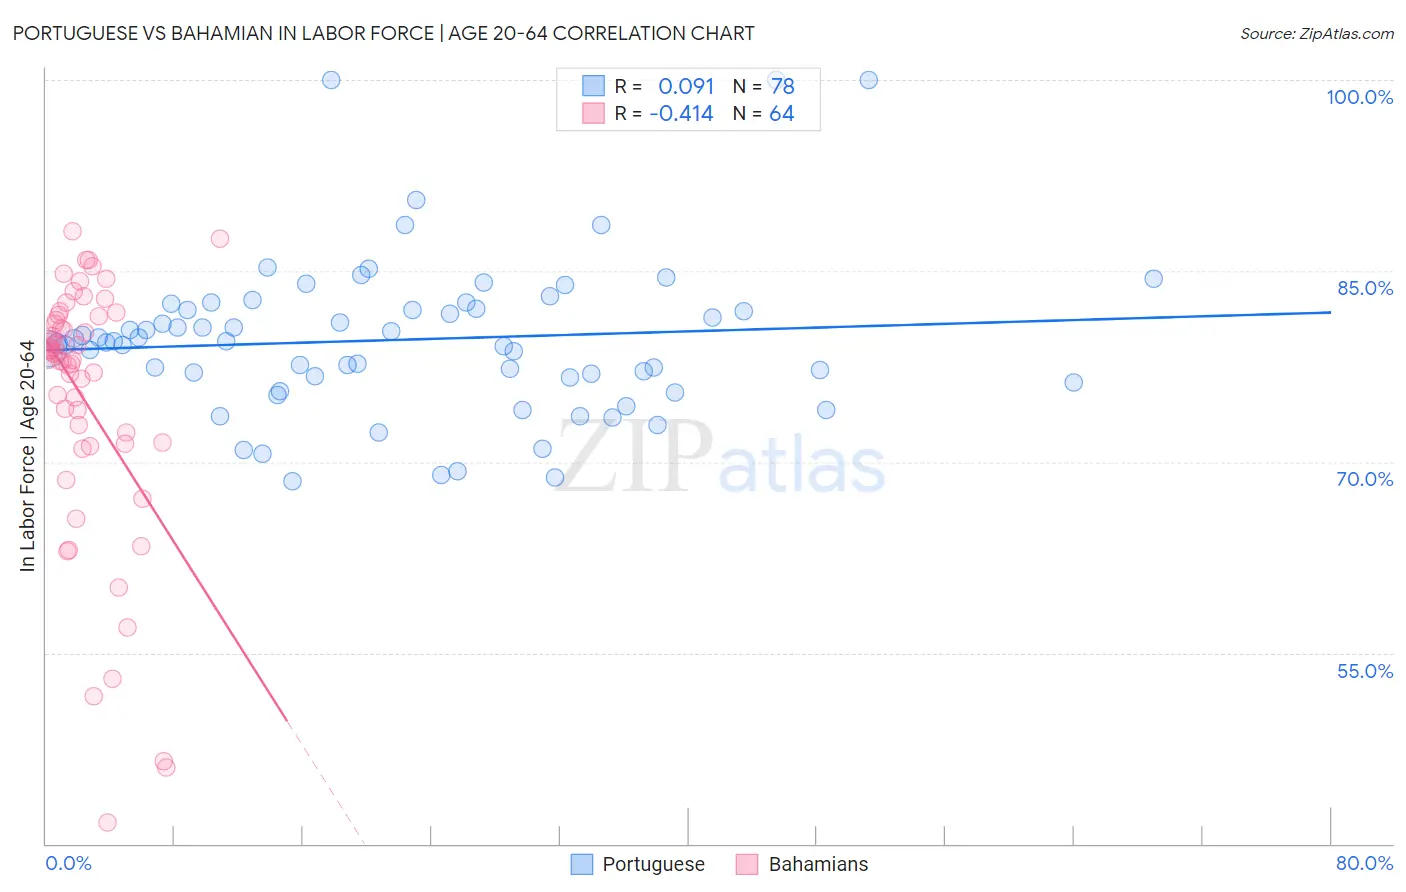
Portuguese vs Bahamian In Labor Force | Age 20-64 Correlation Chart
The statistical analysis conducted on geographies consisting of 450,360,065 people shows a slight positive correlation between the proportion of Portuguese and labor force participation rate among population between the ages 20 and 64 in the United States with a correlation coefficient (R) of 0.091 and weighted average of 79.1%. Similarly, the statistical analysis conducted on geographies consisting of 112,707,980 people shows a moderate negative correlation between the proportion of Bahamians and labor force participation rate among population between the ages 20 and 64 in the United States with a correlation coefficient (R) of -0.414 and weighted average of 78.4%, a difference of 0.97%.
In Labor Force | Age 20-64 Correlation Summary
| Measurement | Portuguese | Bahamian |
| Minimum | 68.5% | 41.7% |
| Maximum | 100.0% | 88.1% |
| Range | 31.5% | 46.4% |
| Mean | 79.6% | 74.8% |
| Median | 79.4% | 78.3% |
| Interquartile 25% (IQ1) | 76.7% | 71.5% |
| Interquartile 75% (IQ3) | 82.0% | 81.3% |
| Interquartile Range (IQR) | 5.3% | 9.8% |
| Standard Deviation (Sample) | 6.2% | 10.4% |
| Standard Deviation (Population) | 6.1% | 10.3% |
Similar Demographics by In Labor Force | Age 20-64
Demographics Similar to Portuguese by In Labor Force | Age 20-64
In terms of in labor force | age 20-64, the demographic groups most similar to Portuguese are Immigrants from Uzbekistan (79.1%, a difference of 0.010%), Immigrants from Panama (79.1%, a difference of 0.020%), Canadian (79.1%, a difference of 0.020%), Central American (79.1%, a difference of 0.020%), and Immigrants from Western Europe (79.1%, a difference of 0.020%).
| Demographics | Rating | Rank | In Labor Force | Age 20-64 |
| Immigrants | England | 9.3 /100 | #218 | Tragic 79.2% |
| French Canadians | 8.4 /100 | #219 | Tragic 79.2% |
| Immigrants | Immigrants | 7.7 /100 | #220 | Tragic 79.2% |
| Hungarians | 7.2 /100 | #221 | Tragic 79.2% |
| Immigrants | Panama | 6.9 /100 | #222 | Tragic 79.1% |
| Canadians | 6.8 /100 | #223 | Tragic 79.1% |
| Immigrants | Uzbekistan | 6.8 /100 | #224 | Tragic 79.1% |
| Portuguese | 6.4 /100 | #225 | Tragic 79.1% |
| Central Americans | 5.9 /100 | #226 | Tragic 79.1% |
| Immigrants | Western Europe | 5.9 /100 | #227 | Tragic 79.1% |
| Panamanians | 5.7 /100 | #228 | Tragic 79.1% |
| Alsatians | 5.7 /100 | #229 | Tragic 79.1% |
| Native Hawaiians | 5.6 /100 | #230 | Tragic 79.1% |
| Lebanese | 5.1 /100 | #231 | Tragic 79.1% |
| Guamanians/Chamorros | 4.5 /100 | #232 | Tragic 79.1% |
Demographics Similar to Bahamians by In Labor Force | Age 20-64
In terms of in labor force | age 20-64, the demographic groups most similar to Bahamians are British West Indian (78.4%, a difference of 0.010%), U.S. Virgin Islander (78.4%, a difference of 0.020%), West Indian (78.3%, a difference of 0.040%), Pennsylvania German (78.4%, a difference of 0.050%), and Spaniard (78.4%, a difference of 0.050%).
| Demographics | Rating | Rank | In Labor Force | Age 20-64 |
| Tsimshian | 0.4 /100 | #259 | Tragic 78.7% |
| Immigrants | Fiji | 0.3 /100 | #260 | Tragic 78.6% |
| Whites/Caucasians | 0.2 /100 | #261 | Tragic 78.5% |
| Fijians | 0.1 /100 | #262 | Tragic 78.4% |
| Pennsylvania Germans | 0.1 /100 | #263 | Tragic 78.4% |
| Spaniards | 0.1 /100 | #264 | Tragic 78.4% |
| British West Indians | 0.1 /100 | #265 | Tragic 78.4% |
| Bahamians | 0.1 /100 | #266 | Tragic 78.4% |
| U.S. Virgin Islanders | 0.1 /100 | #267 | Tragic 78.4% |
| West Indians | 0.0 /100 | #268 | Tragic 78.3% |
| Immigrants | Barbados | 0.0 /100 | #269 | Tragic 78.3% |
| Scotch-Irish | 0.0 /100 | #270 | Tragic 78.3% |
| Immigrants | Latin America | 0.0 /100 | #271 | Tragic 78.3% |
| Marshallese | 0.0 /100 | #272 | Tragic 78.3% |
| French American Indians | 0.0 /100 | #273 | Tragic 78.2% |