Pima vs Ethiopian In Labor Force | Age 20-24
COMPARE
Pima
Ethiopian
In Labor Force | Age 20-24
In Labor Force | Age 20-24 Comparison
Pima
Ethiopians
69.0%
IN LABOR FORCE | AGE 20-24
0.0/ 100
METRIC RATING
338th/ 347
METRIC RANK
77.3%
IN LABOR FORCE | AGE 20-24
100.0/ 100
METRIC RATING
47th/ 347
METRIC RANK
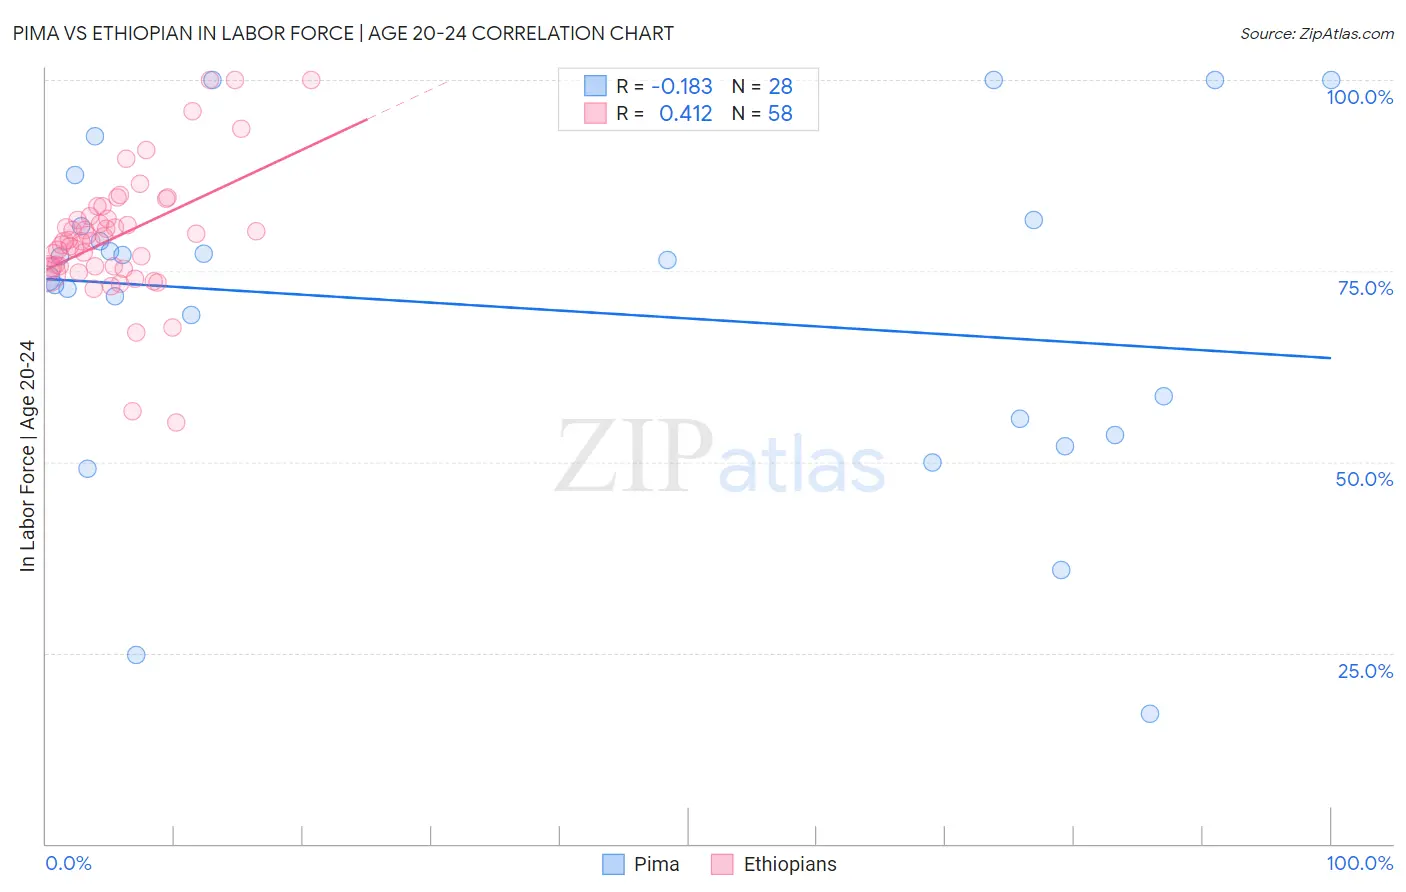
Pima vs Ethiopian In Labor Force | Age 20-24 Correlation Chart
The statistical analysis conducted on geographies consisting of 61,528,696 people shows a poor negative correlation between the proportion of Pima and labor force participation rate among population between the ages 20 and 24 in the United States with a correlation coefficient (R) of -0.183 and weighted average of 69.0%. Similarly, the statistical analysis conducted on geographies consisting of 223,247,985 people shows a moderate positive correlation between the proportion of Ethiopians and labor force participation rate among population between the ages 20 and 24 in the United States with a correlation coefficient (R) of 0.412 and weighted average of 77.3%, a difference of 12.0%.
In Labor Force | Age 20-24 Correlation Summary
| Measurement | Pima | Ethiopian |
| Minimum | 17.1% | 55.1% |
| Maximum | 100.0% | 100.0% |
| Range | 82.9% | 44.9% |
| Mean | 70.2% | 79.6% |
| Median | 75.2% | 79.0% |
| Interquartile 25% (IQ1) | 54.6% | 75.5% |
| Interquartile 75% (IQ3) | 81.2% | 82.2% |
| Interquartile Range (IQR) | 26.6% | 6.7% |
| Standard Deviation (Sample) | 21.8% | 8.4% |
| Standard Deviation (Population) | 21.4% | 8.3% |
Similar Demographics by In Labor Force | Age 20-24
Demographics Similar to Pima by In Labor Force | Age 20-24
In terms of in labor force | age 20-24, the demographic groups most similar to Pima are Immigrants from Yemen (68.9%, a difference of 0.13%), Guyanese (69.2%, a difference of 0.26%), Immigrants from Guyana (69.3%, a difference of 0.39%), Menominee (68.7%, a difference of 0.44%), and Tohono O'odham (68.6%, a difference of 0.57%).
| Demographics | Rating | Rank | In Labor Force | Age 20-24 |
| Immigrants | Bangladesh | 0.0 /100 | #331 | Tragic 70.6% |
| Immigrants | Uzbekistan | 0.0 /100 | #332 | Tragic 70.4% |
| Yuman | 0.0 /100 | #333 | Tragic 70.3% |
| British West Indians | 0.0 /100 | #334 | Tragic 70.0% |
| Immigrants | Barbados | 0.0 /100 | #335 | Tragic 69.7% |
| Immigrants | Guyana | 0.0 /100 | #336 | Tragic 69.3% |
| Guyanese | 0.0 /100 | #337 | Tragic 69.2% |
| Pima | 0.0 /100 | #338 | Tragic 69.0% |
| Immigrants | Yemen | 0.0 /100 | #339 | Tragic 68.9% |
| Menominee | 0.0 /100 | #340 | Tragic 68.7% |
| Tohono O'odham | 0.0 /100 | #341 | Tragic 68.6% |
| Immigrants | St. Vincent and the Grenadines | 0.0 /100 | #342 | Tragic 68.4% |
| Puerto Ricans | 0.0 /100 | #343 | Tragic 68.3% |
| Immigrants | Grenada | 0.0 /100 | #344 | Tragic 67.2% |
| Hopi | 0.0 /100 | #345 | Tragic 66.0% |
Demographics Similar to Ethiopians by In Labor Force | Age 20-24
In terms of in labor force | age 20-24, the demographic groups most similar to Ethiopians are Serbian (77.3%, a difference of 0.050%), Samoan (77.4%, a difference of 0.060%), Chinese (77.3%, a difference of 0.060%), Native Hawaiian (77.4%, a difference of 0.070%), and Fijian (77.4%, a difference of 0.080%).
| Demographics | Rating | Rank | In Labor Force | Age 20-24 |
| Scottish | 100.0 /100 | #40 | Exceptional 77.4% |
| Immigrants | Congo | 100.0 /100 | #41 | Exceptional 77.4% |
| French | 100.0 /100 | #42 | Exceptional 77.4% |
| Immigrants | Laos | 100.0 /100 | #43 | Exceptional 77.4% |
| Fijians | 100.0 /100 | #44 | Exceptional 77.4% |
| Native Hawaiians | 100.0 /100 | #45 | Exceptional 77.4% |
| Samoans | 100.0 /100 | #46 | Exceptional 77.4% |
| Ethiopians | 100.0 /100 | #47 | Exceptional 77.3% |
| Serbians | 100.0 /100 | #48 | Exceptional 77.3% |
| Chinese | 100.0 /100 | #49 | Exceptional 77.3% |
| Malaysians | 100.0 /100 | #50 | Exceptional 77.2% |
| Croatians | 100.0 /100 | #51 | Exceptional 77.2% |
| Indonesians | 100.0 /100 | #52 | Exceptional 77.2% |
| Immigrants | Azores | 100.0 /100 | #53 | Exceptional 77.2% |
| Celtics | 99.9 /100 | #54 | Exceptional 77.1% |