U.S. Virgin Islander vs Ethiopian In Labor Force | Age 20-24
COMPARE
U.S. Virgin Islander
Ethiopian
In Labor Force | Age 20-24
In Labor Force | Age 20-24 Comparison
U.S. Virgin Islanders
Ethiopians
73.0%
IN LABOR FORCE | AGE 20-24
0.1/ 100
METRIC RATING
289th/ 347
METRIC RANK
77.3%
IN LABOR FORCE | AGE 20-24
100.0/ 100
METRIC RATING
47th/ 347
METRIC RANK
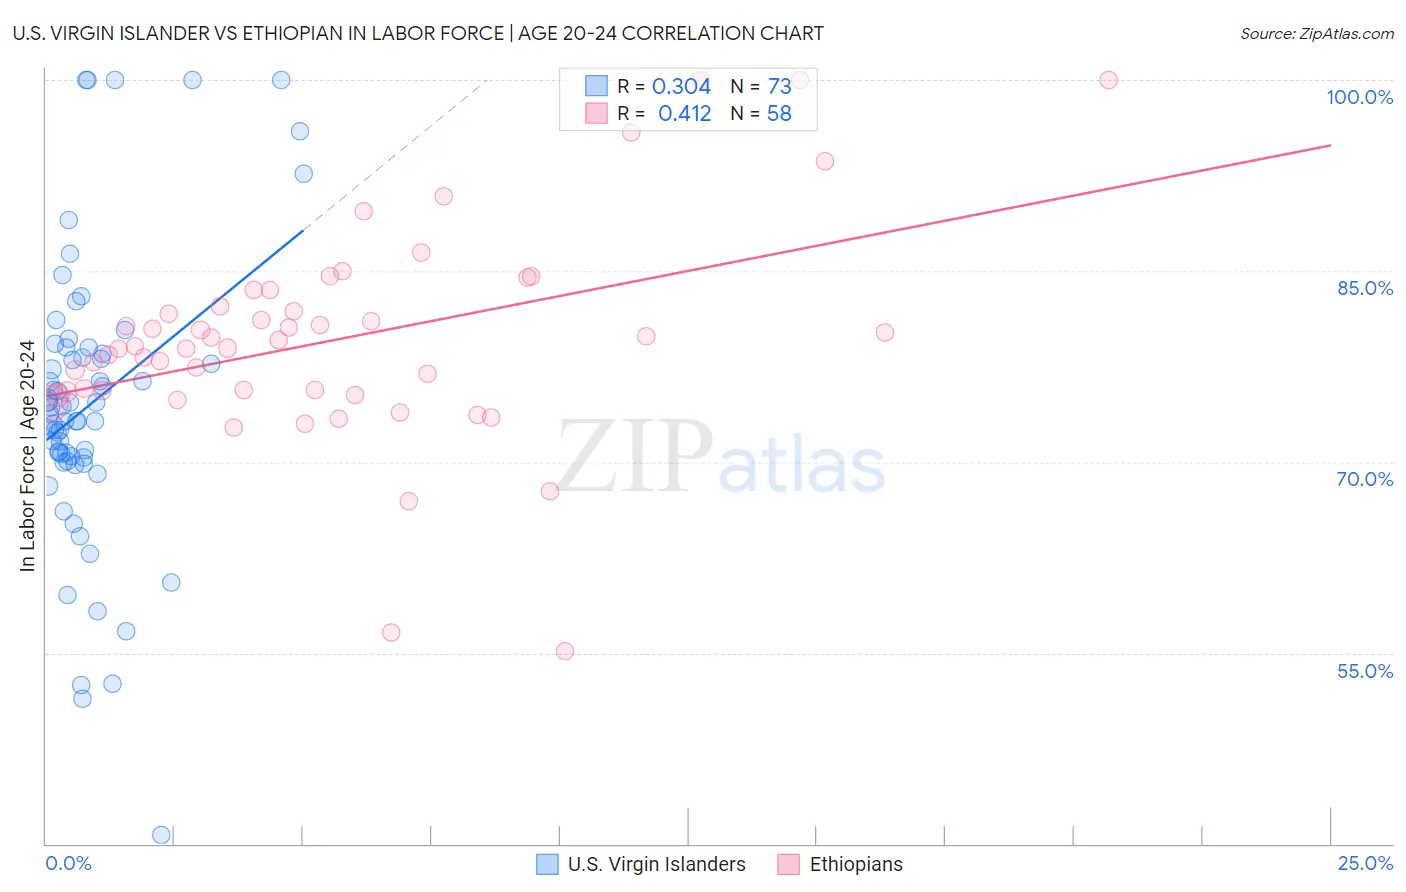
U.S. Virgin Islander vs Ethiopian In Labor Force | Age 20-24 Correlation Chart
The statistical analysis conducted on geographies consisting of 87,526,694 people shows a mild positive correlation between the proportion of U.S. Virgin Islanders and labor force participation rate among population between the ages 20 and 24 in the United States with a correlation coefficient (R) of 0.304 and weighted average of 73.0%. Similarly, the statistical analysis conducted on geographies consisting of 223,247,985 people shows a moderate positive correlation between the proportion of Ethiopians and labor force participation rate among population between the ages 20 and 24 in the United States with a correlation coefficient (R) of 0.412 and weighted average of 77.3%, a difference of 5.8%.
In Labor Force | Age 20-24 Correlation Summary
| Measurement | U.S. Virgin Islander | Ethiopian |
| Minimum | 40.7% | 55.1% |
| Maximum | 100.0% | 100.0% |
| Range | 59.3% | 44.9% |
| Mean | 74.5% | 79.6% |
| Median | 73.8% | 79.0% |
| Interquartile 25% (IQ1) | 70.2% | 75.5% |
| Interquartile 75% (IQ3) | 78.7% | 82.2% |
| Interquartile Range (IQR) | 8.5% | 6.7% |
| Standard Deviation (Sample) | 11.3% | 8.4% |
| Standard Deviation (Population) | 11.2% | 8.3% |
Similar Demographics by In Labor Force | Age 20-24
Demographics Similar to U.S. Virgin Islanders by In Labor Force | Age 20-24
In terms of in labor force | age 20-24, the demographic groups most similar to U.S. Virgin Islanders are Argentinean (73.1%, a difference of 0.030%), Immigrants from Belarus (73.0%, a difference of 0.080%), Immigrants from Korea (73.1%, a difference of 0.11%), Immigrants from Lebanon (73.1%, a difference of 0.13%), and Immigrants from Nicaragua (72.9%, a difference of 0.15%).
| Demographics | Rating | Rank | In Labor Force | Age 20-24 |
| Immigrants | Spain | 0.1 /100 | #282 | Tragic 73.2% |
| Immigrants | Bahamas | 0.1 /100 | #283 | Tragic 73.2% |
| Kiowa | 0.1 /100 | #284 | Tragic 73.2% |
| Nicaraguans | 0.1 /100 | #285 | Tragic 73.2% |
| Immigrants | Lebanon | 0.1 /100 | #286 | Tragic 73.1% |
| Immigrants | Korea | 0.1 /100 | #287 | Tragic 73.1% |
| Argentineans | 0.1 /100 | #288 | Tragic 73.1% |
| U.S. Virgin Islanders | 0.1 /100 | #289 | Tragic 73.0% |
| Immigrants | Belarus | 0.1 /100 | #290 | Tragic 73.0% |
| Immigrants | Nicaragua | 0.0 /100 | #291 | Tragic 72.9% |
| Pueblo | 0.0 /100 | #292 | Tragic 72.9% |
| Immigrants | Belize | 0.0 /100 | #293 | Tragic 72.8% |
| Immigrants | Argentina | 0.0 /100 | #294 | Tragic 72.8% |
| Okinawans | 0.0 /100 | #295 | Tragic 72.7% |
| Jamaicans | 0.0 /100 | #296 | Tragic 72.7% |
Demographics Similar to Ethiopians by In Labor Force | Age 20-24
In terms of in labor force | age 20-24, the demographic groups most similar to Ethiopians are Serbian (77.3%, a difference of 0.050%), Samoan (77.4%, a difference of 0.060%), Chinese (77.3%, a difference of 0.060%), Native Hawaiian (77.4%, a difference of 0.070%), and Fijian (77.4%, a difference of 0.080%).
| Demographics | Rating | Rank | In Labor Force | Age 20-24 |
| Scottish | 100.0 /100 | #40 | Exceptional 77.4% |
| Immigrants | Congo | 100.0 /100 | #41 | Exceptional 77.4% |
| French | 100.0 /100 | #42 | Exceptional 77.4% |
| Immigrants | Laos | 100.0 /100 | #43 | Exceptional 77.4% |
| Fijians | 100.0 /100 | #44 | Exceptional 77.4% |
| Native Hawaiians | 100.0 /100 | #45 | Exceptional 77.4% |
| Samoans | 100.0 /100 | #46 | Exceptional 77.4% |
| Ethiopians | 100.0 /100 | #47 | Exceptional 77.3% |
| Serbians | 100.0 /100 | #48 | Exceptional 77.3% |
| Chinese | 100.0 /100 | #49 | Exceptional 77.3% |
| Malaysians | 100.0 /100 | #50 | Exceptional 77.2% |
| Croatians | 100.0 /100 | #51 | Exceptional 77.2% |
| Indonesians | 100.0 /100 | #52 | Exceptional 77.2% |
| Immigrants | Azores | 100.0 /100 | #53 | Exceptional 77.2% |
| Celtics | 99.9 /100 | #54 | Exceptional 77.1% |