Pima vs Immigrants from Jamaica In Labor Force | Age 20-24
COMPARE
Pima
Immigrants from Jamaica
In Labor Force | Age 20-24
In Labor Force | Age 20-24 Comparison
Pima
Immigrants from Jamaica
69.0%
IN LABOR FORCE | AGE 20-24
0.0/ 100
METRIC RATING
338th/ 347
METRIC RANK
72.4%
IN LABOR FORCE | AGE 20-24
0.0/ 100
METRIC RATING
306th/ 347
METRIC RANK
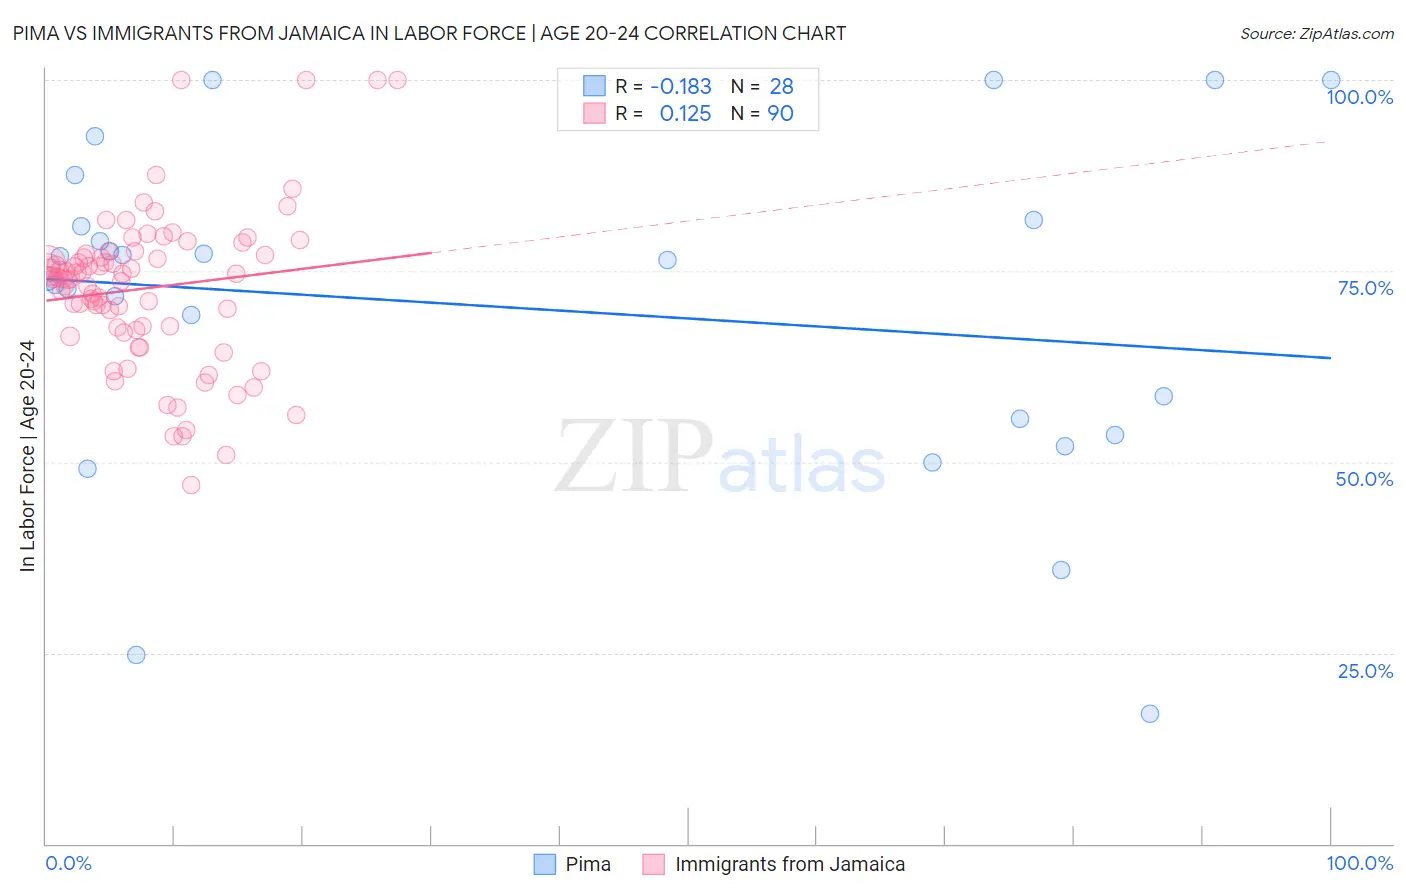
Pima vs Immigrants from Jamaica In Labor Force | Age 20-24 Correlation Chart
The statistical analysis conducted on geographies consisting of 61,528,696 people shows a poor negative correlation between the proportion of Pima and labor force participation rate among population between the ages 20 and 24 in the United States with a correlation coefficient (R) of -0.183 and weighted average of 69.0%. Similarly, the statistical analysis conducted on geographies consisting of 301,749,902 people shows a poor positive correlation between the proportion of Immigrants from Jamaica and labor force participation rate among population between the ages 20 and 24 in the United States with a correlation coefficient (R) of 0.125 and weighted average of 72.4%, a difference of 4.9%.
In Labor Force | Age 20-24 Correlation Summary
| Measurement | Pima | Immigrants from Jamaica |
| Minimum | 17.1% | 46.9% |
| Maximum | 100.0% | 100.0% |
| Range | 82.9% | 53.1% |
| Mean | 70.2% | 72.7% |
| Median | 75.2% | 74.1% |
| Interquartile 25% (IQ1) | 54.6% | 67.7% |
| Interquartile 75% (IQ3) | 81.2% | 77.1% |
| Interquartile Range (IQR) | 26.6% | 9.4% |
| Standard Deviation (Sample) | 21.8% | 10.1% |
| Standard Deviation (Population) | 21.4% | 10.0% |
Similar Demographics by In Labor Force | Age 20-24
Demographics Similar to Pima by In Labor Force | Age 20-24
In terms of in labor force | age 20-24, the demographic groups most similar to Pima are Immigrants from Yemen (68.9%, a difference of 0.13%), Guyanese (69.2%, a difference of 0.26%), Immigrants from Guyana (69.3%, a difference of 0.39%), Menominee (68.7%, a difference of 0.44%), and Tohono O'odham (68.6%, a difference of 0.57%).
| Demographics | Rating | Rank | In Labor Force | Age 20-24 |
| Immigrants | Bangladesh | 0.0 /100 | #331 | Tragic 70.6% |
| Immigrants | Uzbekistan | 0.0 /100 | #332 | Tragic 70.4% |
| Yuman | 0.0 /100 | #333 | Tragic 70.3% |
| British West Indians | 0.0 /100 | #334 | Tragic 70.0% |
| Immigrants | Barbados | 0.0 /100 | #335 | Tragic 69.7% |
| Immigrants | Guyana | 0.0 /100 | #336 | Tragic 69.3% |
| Guyanese | 0.0 /100 | #337 | Tragic 69.2% |
| Pima | 0.0 /100 | #338 | Tragic 69.0% |
| Immigrants | Yemen | 0.0 /100 | #339 | Tragic 68.9% |
| Menominee | 0.0 /100 | #340 | Tragic 68.7% |
| Tohono O'odham | 0.0 /100 | #341 | Tragic 68.6% |
| Immigrants | St. Vincent and the Grenadines | 0.0 /100 | #342 | Tragic 68.4% |
| Puerto Ricans | 0.0 /100 | #343 | Tragic 68.3% |
| Immigrants | Grenada | 0.0 /100 | #344 | Tragic 67.2% |
| Hopi | 0.0 /100 | #345 | Tragic 66.0% |
Demographics Similar to Immigrants from Jamaica by In Labor Force | Age 20-24
In terms of in labor force | age 20-24, the demographic groups most similar to Immigrants from Jamaica are Immigrants from Singapore (72.4%, a difference of 0.020%), Immigrants from West Indies (72.4%, a difference of 0.050%), Ecuadorian (72.4%, a difference of 0.060%), Native/Alaskan (72.4%, a difference of 0.070%), and Immigrants from Ecuador (72.3%, a difference of 0.15%).
| Demographics | Rating | Rank | In Labor Force | Age 20-24 |
| Iranians | 0.0 /100 | #299 | Tragic 72.6% |
| Armenians | 0.0 /100 | #300 | Tragic 72.5% |
| Cubans | 0.0 /100 | #301 | Tragic 72.5% |
| Natives/Alaskans | 0.0 /100 | #302 | Tragic 72.4% |
| Ecuadorians | 0.0 /100 | #303 | Tragic 72.4% |
| Immigrants | West Indies | 0.0 /100 | #304 | Tragic 72.4% |
| Immigrants | Singapore | 0.0 /100 | #305 | Tragic 72.4% |
| Immigrants | Jamaica | 0.0 /100 | #306 | Tragic 72.4% |
| Immigrants | Ecuador | 0.0 /100 | #307 | Tragic 72.3% |
| Soviet Union | 0.0 /100 | #308 | Tragic 72.3% |
| Tsimshian | 0.0 /100 | #309 | Tragic 72.3% |
| Immigrants | Cuba | 0.0 /100 | #310 | Tragic 72.0% |
| Apache | 0.0 /100 | #311 | Tragic 72.0% |
| Immigrants | Caribbean | 0.0 /100 | #312 | Tragic 71.9% |
| Immigrants | Dominica | 0.0 /100 | #313 | Tragic 71.9% |