South American vs Menominee In Labor Force | Age > 16
COMPARE
South American
Menominee
In Labor Force | Age > 16
In Labor Force | Age > 16 Comparison
South Americans
Menominee
66.0%
IN LABOR FORCE | AGE > 16
99.4/ 100
METRIC RATING
86th/ 347
METRIC RANK
60.6%
IN LABOR FORCE | AGE > 16
0.0/ 100
METRIC RATING
336th/ 347
METRIC RANK
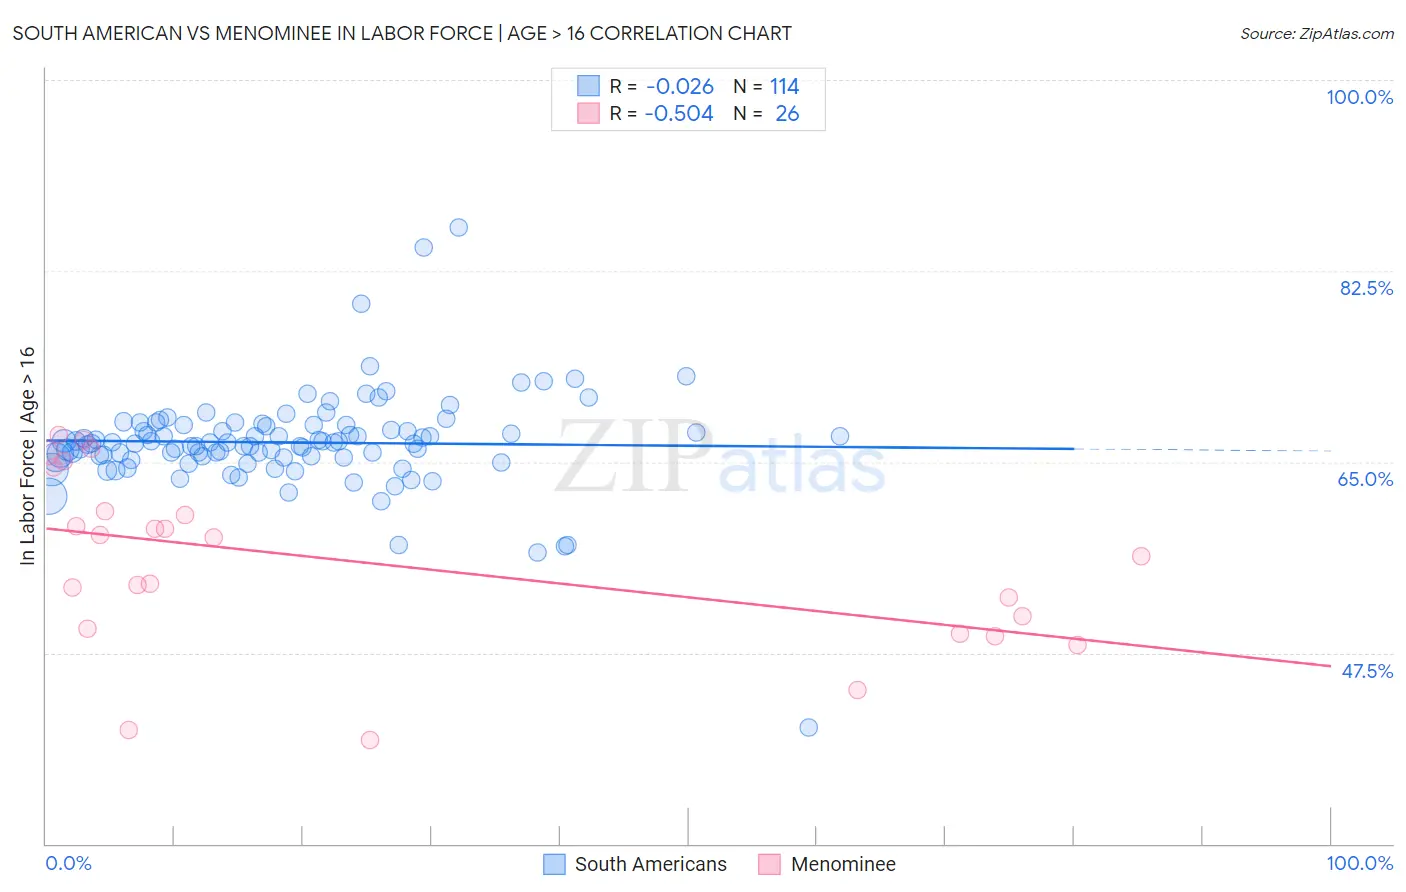
South American vs Menominee In Labor Force | Age > 16 Correlation Chart
The statistical analysis conducted on geographies consisting of 494,183,662 people shows no correlation between the proportion of South Americans and labor force participation rate among population ages 16 and over in the United States with a correlation coefficient (R) of -0.026 and weighted average of 66.0%. Similarly, the statistical analysis conducted on geographies consisting of 45,777,849 people shows a substantial negative correlation between the proportion of Menominee and labor force participation rate among population ages 16 and over in the United States with a correlation coefficient (R) of -0.504 and weighted average of 60.6%, a difference of 9.0%.
In Labor Force | Age > 16 Correlation Summary
| Measurement | South American | Menominee |
| Minimum | 40.6% | 39.5% |
| Maximum | 86.5% | 67.4% |
| Range | 45.9% | 27.9% |
| Mean | 66.8% | 55.8% |
| Median | 66.7% | 57.2% |
| Interquartile 25% (IQ1) | 65.5% | 49.8% |
| Interquartile 75% (IQ3) | 68.3% | 60.5% |
| Interquartile Range (IQR) | 2.9% | 10.7% |
| Standard Deviation (Sample) | 4.7% | 8.0% |
| Standard Deviation (Population) | 4.7% | 7.8% |
Similar Demographics by In Labor Force | Age > 16
Demographics Similar to South Americans by In Labor Force | Age > 16
In terms of in labor force | age > 16, the demographic groups most similar to South Americans are South American Indian (66.0%, a difference of 0.010%), Bermudan (66.0%, a difference of 0.010%), Mongolian (66.1%, a difference of 0.020%), Central American (66.1%, a difference of 0.030%), and German Russian (66.1%, a difference of 0.040%).
| Demographics | Rating | Rank | In Labor Force | Age > 16 |
| Turks | 99.6 /100 | #79 | Exceptional 66.1% |
| Malaysians | 99.6 /100 | #80 | Exceptional 66.1% |
| Moroccans | 99.5 /100 | #81 | Exceptional 66.1% |
| German Russians | 99.4 /100 | #82 | Exceptional 66.1% |
| Immigrants | Jordan | 99.4 /100 | #83 | Exceptional 66.1% |
| Central Americans | 99.4 /100 | #84 | Exceptional 66.1% |
| Mongolians | 99.4 /100 | #85 | Exceptional 66.1% |
| South Americans | 99.4 /100 | #86 | Exceptional 66.0% |
| South American Indians | 99.4 /100 | #87 | Exceptional 66.0% |
| Bermudans | 99.3 /100 | #88 | Exceptional 66.0% |
| Immigrants | Laos | 99.2 /100 | #89 | Exceptional 66.0% |
| Chileans | 99.2 /100 | #90 | Exceptional 66.0% |
| Iranians | 99.2 /100 | #91 | Exceptional 66.0% |
| Aleuts | 99.1 /100 | #92 | Exceptional 66.0% |
| Immigrants | South America | 99.1 /100 | #93 | Exceptional 66.0% |
Demographics Similar to Menominee by In Labor Force | Age > 16
In terms of in labor force | age > 16, the demographic groups most similar to Menominee are Native/Alaskan (60.6%, a difference of 0.020%), Apache (60.7%, a difference of 0.21%), Paiute (60.7%, a difference of 0.26%), Crow (60.8%, a difference of 0.34%), and Ute (60.9%, a difference of 0.51%).
| Demographics | Rating | Rank | In Labor Force | Age > 16 |
| Choctaw | 0.0 /100 | #329 | Tragic 61.5% |
| Creek | 0.0 /100 | #330 | Tragic 61.3% |
| Ute | 0.0 /100 | #331 | Tragic 60.9% |
| Crow | 0.0 /100 | #332 | Tragic 60.8% |
| Paiute | 0.0 /100 | #333 | Tragic 60.7% |
| Apache | 0.0 /100 | #334 | Tragic 60.7% |
| Natives/Alaskans | 0.0 /100 | #335 | Tragic 60.6% |
| Menominee | 0.0 /100 | #336 | Tragic 60.6% |
| Colville | 0.0 /100 | #337 | Tragic 59.8% |
| Immigrants | Yemen | 0.0 /100 | #338 | Tragic 59.6% |
| Houma | 0.0 /100 | #339 | Tragic 59.5% |
| Pueblo | 0.0 /100 | #340 | Tragic 59.3% |
| Hopi | 0.0 /100 | #341 | Tragic 58.4% |
| Puerto Ricans | 0.0 /100 | #342 | Tragic 58.1% |
| Yuman | 0.0 /100 | #343 | Tragic 57.8% |