Pennsylvania German vs Immigrants from Vietnam In Labor Force | Age 30-34
COMPARE
Pennsylvania German
Immigrants from Vietnam
In Labor Force | Age 30-34
In Labor Force | Age 30-34 Comparison
Pennsylvania Germans
Immigrants from Vietnam
82.6%
IN LABOR FORCE | AGE 30-34
0.0/ 100
METRIC RATING
295th/ 347
METRIC RANK
85.0%
IN LABOR FORCE | AGE 30-34
86.5/ 100
METRIC RATING
140th/ 347
METRIC RANK
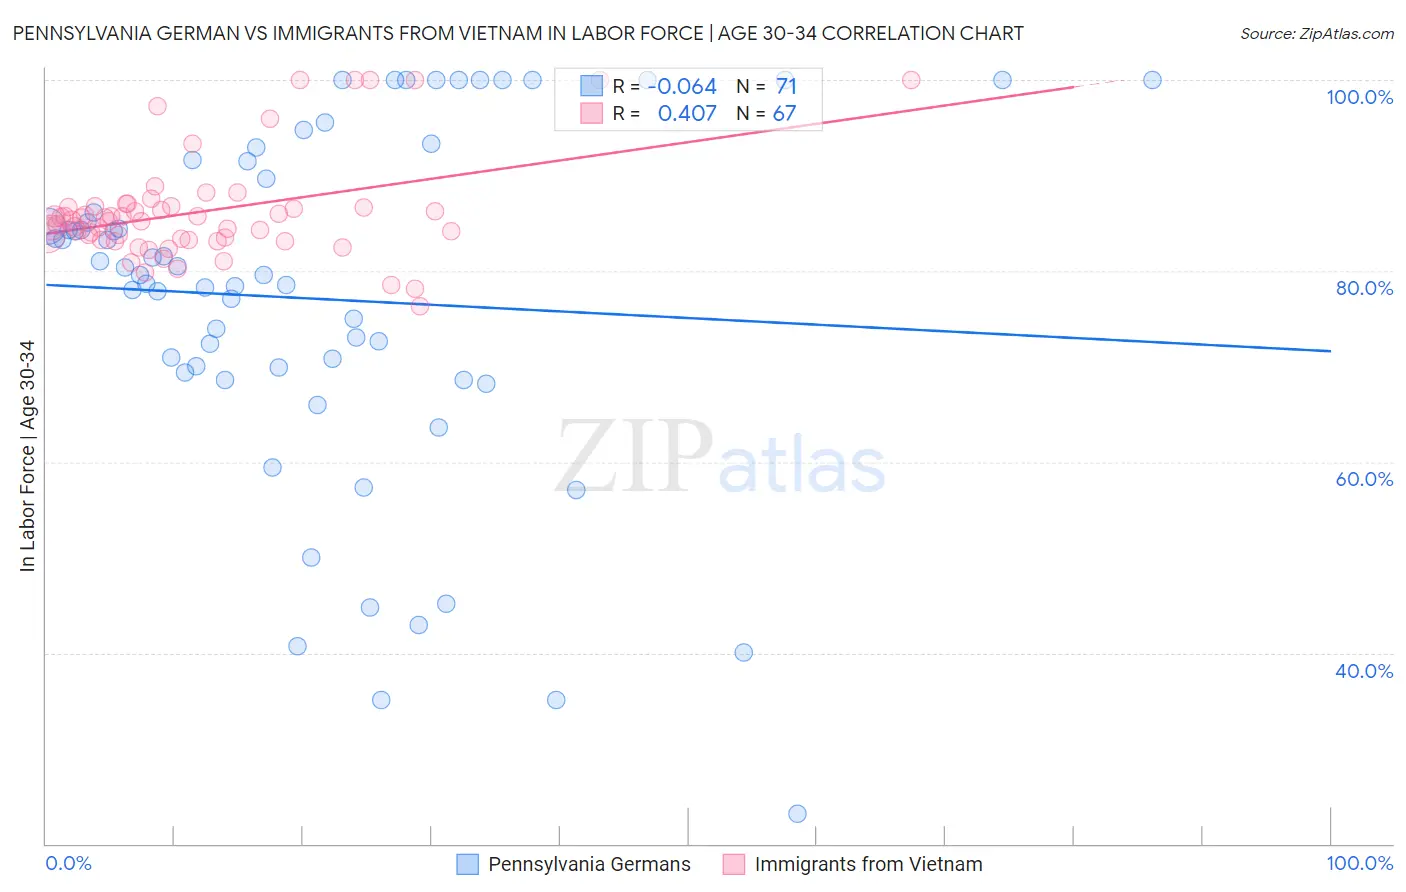
Pennsylvania German vs Immigrants from Vietnam In Labor Force | Age 30-34 Correlation Chart
The statistical analysis conducted on geographies consisting of 233,986,742 people shows a slight negative correlation between the proportion of Pennsylvania Germans and labor force participation rate among population between the ages 30 and 34 in the United States with a correlation coefficient (R) of -0.064 and weighted average of 82.6%. Similarly, the statistical analysis conducted on geographies consisting of 404,594,648 people shows a moderate positive correlation between the proportion of Immigrants from Vietnam and labor force participation rate among population between the ages 30 and 34 in the United States with a correlation coefficient (R) of 0.407 and weighted average of 85.0%, a difference of 2.9%.
In Labor Force | Age 30-34 Correlation Summary
| Measurement | Pennsylvania German | Immigrants from Vietnam |
| Minimum | 23.2% | 76.3% |
| Maximum | 100.0% | 100.0% |
| Range | 76.8% | 23.7% |
| Mean | 77.1% | 86.2% |
| Median | 79.6% | 85.3% |
| Interquartile 25% (IQ1) | 69.4% | 83.3% |
| Interquartile 75% (IQ3) | 91.4% | 86.8% |
| Interquartile Range (IQR) | 22.0% | 3.6% |
| Standard Deviation (Sample) | 18.4% | 5.5% |
| Standard Deviation (Population) | 18.3% | 5.4% |
Similar Demographics by In Labor Force | Age 30-34
Demographics Similar to Pennsylvania Germans by In Labor Force | Age 30-34
In terms of in labor force | age 30-34, the demographic groups most similar to Pennsylvania Germans are Chippewa (82.6%, a difference of 0.020%), Comanche (82.6%, a difference of 0.030%), Aleut (82.6%, a difference of 0.030%), American (82.7%, a difference of 0.12%), and Nepalese (82.7%, a difference of 0.14%).
| Demographics | Rating | Rank | In Labor Force | Age 30-34 |
| Central American Indians | 0.0 /100 | #288 | Tragic 83.0% |
| Hawaiians | 0.0 /100 | #289 | Tragic 83.0% |
| Blackfeet | 0.0 /100 | #290 | Tragic 82.8% |
| Potawatomi | 0.0 /100 | #291 | Tragic 82.8% |
| Blacks/African Americans | 0.0 /100 | #292 | Tragic 82.8% |
| Nepalese | 0.0 /100 | #293 | Tragic 82.7% |
| Americans | 0.0 /100 | #294 | Tragic 82.7% |
| Pennsylvania Germans | 0.0 /100 | #295 | Tragic 82.6% |
| Chippewa | 0.0 /100 | #296 | Tragic 82.6% |
| Comanche | 0.0 /100 | #297 | Tragic 82.6% |
| Aleuts | 0.0 /100 | #298 | Tragic 82.6% |
| Immigrants | Central America | 0.0 /100 | #299 | Tragic 82.5% |
| Hmong | 0.0 /100 | #300 | Tragic 82.4% |
| Hispanics or Latinos | 0.0 /100 | #301 | Tragic 82.4% |
| Ottawa | 0.0 /100 | #302 | Tragic 82.4% |
Demographics Similar to Immigrants from Vietnam by In Labor Force | Age 30-34
In terms of in labor force | age 30-34, the demographic groups most similar to Immigrants from Vietnam are South African (85.0%, a difference of 0.020%), Sri Lankan (85.0%, a difference of 0.020%), Bhutanese (85.0%, a difference of 0.020%), Chilean (84.9%, a difference of 0.020%), and Jordanian (85.0%, a difference of 0.030%).
| Demographics | Rating | Rank | In Labor Force | Age 30-34 |
| New Zealanders | 89.5 /100 | #133 | Excellent 85.0% |
| Immigrants | Chile | 89.2 /100 | #134 | Excellent 85.0% |
| Immigrants | Asia | 88.9 /100 | #135 | Excellent 85.0% |
| Jordanians | 88.6 /100 | #136 | Excellent 85.0% |
| South Africans | 88.0 /100 | #137 | Excellent 85.0% |
| Sri Lankans | 87.8 /100 | #138 | Excellent 85.0% |
| Bhutanese | 87.5 /100 | #139 | Excellent 85.0% |
| Immigrants | Vietnam | 86.5 /100 | #140 | Excellent 85.0% |
| Chileans | 85.3 /100 | #141 | Excellent 84.9% |
| Immigrants | Indonesia | 84.3 /100 | #142 | Excellent 84.9% |
| Colombians | 82.2 /100 | #143 | Excellent 84.9% |
| Uruguayans | 78.5 /100 | #144 | Good 84.9% |
| Palestinians | 77.7 /100 | #145 | Good 84.9% |
| Immigrants | Saudi Arabia | 76.6 /100 | #146 | Good 84.9% |
| Immigrants | Colombia | 76.3 /100 | #147 | Good 84.9% |