Pennsylvania German vs Russian In Labor Force | Age 30-34
COMPARE
Pennsylvania German
Russian
In Labor Force | Age 30-34
In Labor Force | Age 30-34 Comparison
Pennsylvania Germans
Russians
82.6%
IN LABOR FORCE | AGE 30-34
0.0/ 100
METRIC RATING
295th/ 347
METRIC RANK
85.5%
IN LABOR FORCE | AGE 30-34
99.6/ 100
METRIC RATING
57th/ 347
METRIC RANK
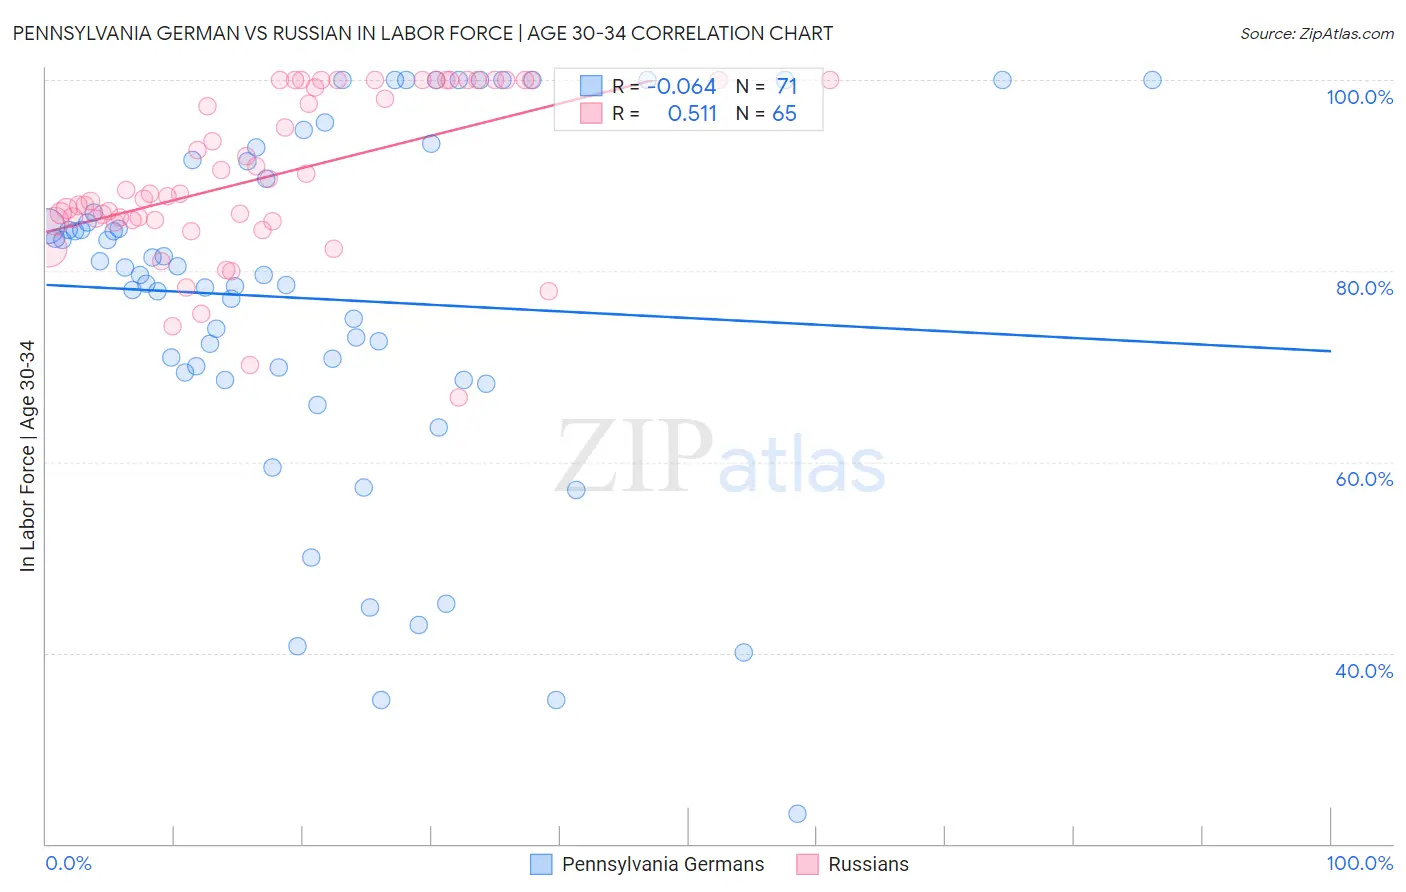
Pennsylvania German vs Russian In Labor Force | Age 30-34 Correlation Chart
The statistical analysis conducted on geographies consisting of 233,986,742 people shows a slight negative correlation between the proportion of Pennsylvania Germans and labor force participation rate among population between the ages 30 and 34 in the United States with a correlation coefficient (R) of -0.064 and weighted average of 82.6%. Similarly, the statistical analysis conducted on geographies consisting of 511,538,984 people shows a substantial positive correlation between the proportion of Russians and labor force participation rate among population between the ages 30 and 34 in the United States with a correlation coefficient (R) of 0.511 and weighted average of 85.5%, a difference of 3.5%.
In Labor Force | Age 30-34 Correlation Summary
| Measurement | Pennsylvania German | Russian |
| Minimum | 23.2% | 66.7% |
| Maximum | 100.0% | 100.0% |
| Range | 76.8% | 33.3% |
| Mean | 77.1% | 89.9% |
| Median | 79.6% | 88.0% |
| Interquartile 25% (IQ1) | 69.4% | 85.2% |
| Interquartile 75% (IQ3) | 91.4% | 100.0% |
| Interquartile Range (IQR) | 22.0% | 14.8% |
| Standard Deviation (Sample) | 18.4% | 8.5% |
| Standard Deviation (Population) | 18.3% | 8.4% |
Similar Demographics by In Labor Force | Age 30-34
Demographics Similar to Pennsylvania Germans by In Labor Force | Age 30-34
In terms of in labor force | age 30-34, the demographic groups most similar to Pennsylvania Germans are Chippewa (82.6%, a difference of 0.020%), Comanche (82.6%, a difference of 0.030%), Aleut (82.6%, a difference of 0.030%), American (82.7%, a difference of 0.12%), and Nepalese (82.7%, a difference of 0.14%).
| Demographics | Rating | Rank | In Labor Force | Age 30-34 |
| Central American Indians | 0.0 /100 | #288 | Tragic 83.0% |
| Hawaiians | 0.0 /100 | #289 | Tragic 83.0% |
| Blackfeet | 0.0 /100 | #290 | Tragic 82.8% |
| Potawatomi | 0.0 /100 | #291 | Tragic 82.8% |
| Blacks/African Americans | 0.0 /100 | #292 | Tragic 82.8% |
| Nepalese | 0.0 /100 | #293 | Tragic 82.7% |
| Americans | 0.0 /100 | #294 | Tragic 82.7% |
| Pennsylvania Germans | 0.0 /100 | #295 | Tragic 82.6% |
| Chippewa | 0.0 /100 | #296 | Tragic 82.6% |
| Comanche | 0.0 /100 | #297 | Tragic 82.6% |
| Aleuts | 0.0 /100 | #298 | Tragic 82.6% |
| Immigrants | Central America | 0.0 /100 | #299 | Tragic 82.5% |
| Hmong | 0.0 /100 | #300 | Tragic 82.4% |
| Hispanics or Latinos | 0.0 /100 | #301 | Tragic 82.4% |
| Ottawa | 0.0 /100 | #302 | Tragic 82.4% |
Demographics Similar to Russians by In Labor Force | Age 30-34
In terms of in labor force | age 30-34, the demographic groups most similar to Russians are Czech (85.5%, a difference of 0.0%), Polish (85.5%, a difference of 0.0%), Immigrants from Kenya (85.5%, a difference of 0.010%), Immigrants from Turkey (85.5%, a difference of 0.010%), and Immigrants from Poland (85.5%, a difference of 0.020%).
| Demographics | Rating | Rank | In Labor Force | Age 30-34 |
| Immigrants | Australia | 99.8 /100 | #50 | Exceptional 85.6% |
| Cape Verdeans | 99.7 /100 | #51 | Exceptional 85.6% |
| Slovenes | 99.7 /100 | #52 | Exceptional 85.6% |
| Filipinos | 99.6 /100 | #53 | Exceptional 85.5% |
| Immigrants | Kenya | 99.6 /100 | #54 | Exceptional 85.5% |
| Immigrants | Turkey | 99.6 /100 | #55 | Exceptional 85.5% |
| Czechs | 99.6 /100 | #56 | Exceptional 85.5% |
| Russians | 99.6 /100 | #57 | Exceptional 85.5% |
| Poles | 99.6 /100 | #58 | Exceptional 85.5% |
| Immigrants | Poland | 99.5 /100 | #59 | Exceptional 85.5% |
| Immigrants | France | 99.5 /100 | #60 | Exceptional 85.5% |
| Immigrants | Brazil | 99.5 /100 | #61 | Exceptional 85.5% |
| Soviet Union | 99.4 /100 | #62 | Exceptional 85.5% |
| Macedonians | 99.4 /100 | #63 | Exceptional 85.5% |
| Italians | 99.4 /100 | #64 | Exceptional 85.4% |