Hungarian vs Immigrants from Vietnam In Labor Force | Age 30-34
COMPARE
Hungarian
Immigrants from Vietnam
In Labor Force | Age 30-34
In Labor Force | Age 30-34 Comparison
Hungarians
Immigrants from Vietnam
84.5%
IN LABOR FORCE | AGE 30-34
24.8/ 100
METRIC RATING
191st/ 347
METRIC RANK
85.0%
IN LABOR FORCE | AGE 30-34
86.5/ 100
METRIC RATING
140th/ 347
METRIC RANK
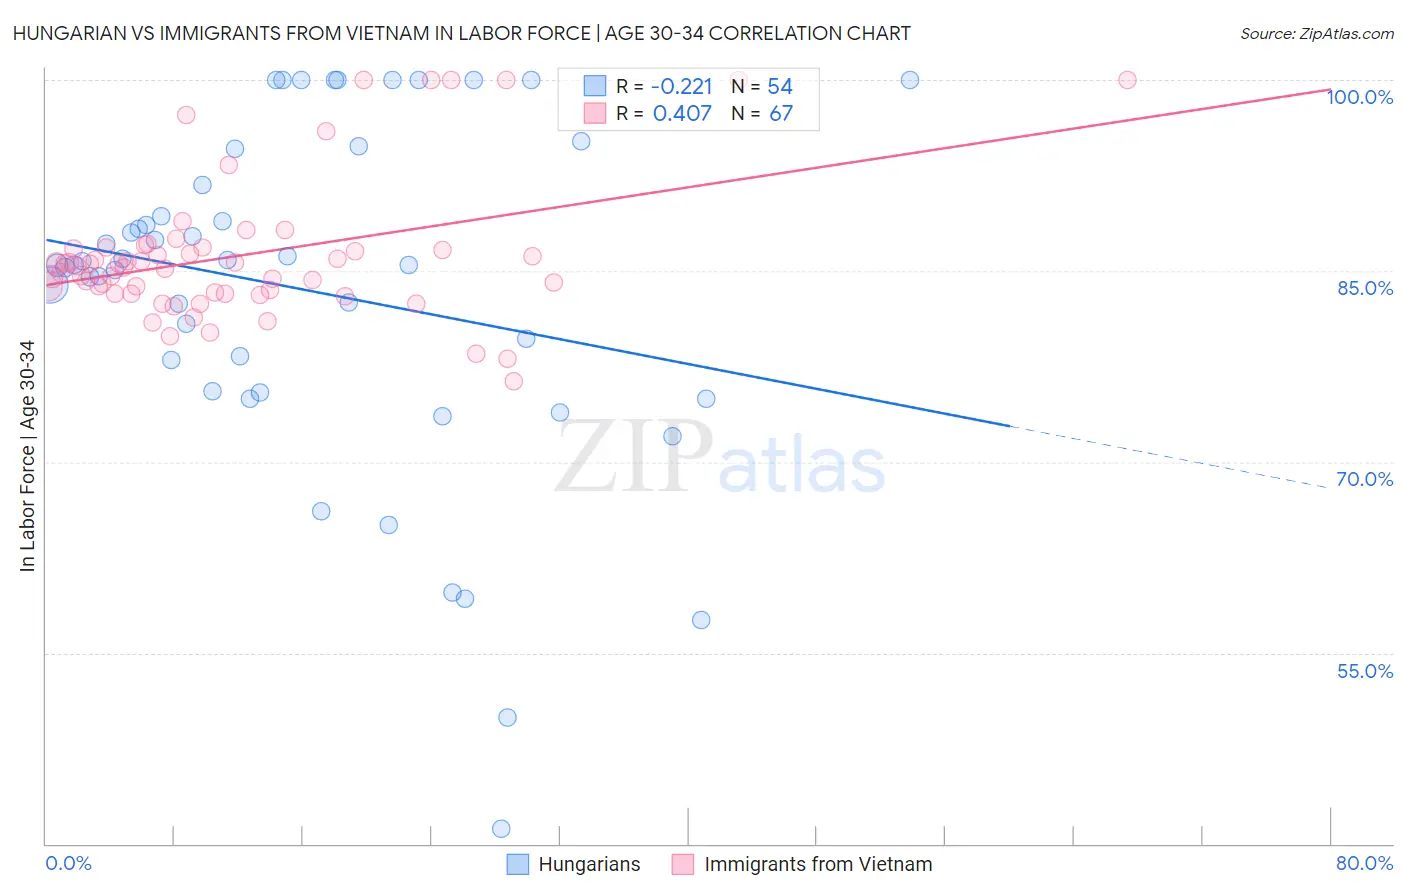
Hungarian vs Immigrants from Vietnam In Labor Force | Age 30-34 Correlation Chart
The statistical analysis conducted on geographies consisting of 485,743,554 people shows a weak negative correlation between the proportion of Hungarians and labor force participation rate among population between the ages 30 and 34 in the United States with a correlation coefficient (R) of -0.221 and weighted average of 84.5%. Similarly, the statistical analysis conducted on geographies consisting of 404,594,648 people shows a moderate positive correlation between the proportion of Immigrants from Vietnam and labor force participation rate among population between the ages 30 and 34 in the United States with a correlation coefficient (R) of 0.407 and weighted average of 85.0%, a difference of 0.52%.
In Labor Force | Age 30-34 Correlation Summary
| Measurement | Hungarian | Immigrants from Vietnam |
| Minimum | 41.2% | 76.3% |
| Maximum | 100.0% | 100.0% |
| Range | 58.8% | 23.7% |
| Mean | 83.5% | 86.2% |
| Median | 85.5% | 85.3% |
| Interquartile 25% (IQ1) | 75.6% | 83.3% |
| Interquartile 75% (IQ3) | 91.7% | 86.8% |
| Interquartile Range (IQR) | 16.1% | 3.6% |
| Standard Deviation (Sample) | 13.4% | 5.5% |
| Standard Deviation (Population) | 13.2% | 5.4% |
Similar Demographics by In Labor Force | Age 30-34
Demographics Similar to Hungarians by In Labor Force | Age 30-34
In terms of in labor force | age 30-34, the demographic groups most similar to Hungarians are Scandinavian (84.5%, a difference of 0.0%), Immigrants from Zaire (84.5%, a difference of 0.010%), Immigrants from Costa Rica (84.5%, a difference of 0.010%), Immigrants from Afghanistan (84.5%, a difference of 0.010%), and Korean (84.5%, a difference of 0.020%).
| Demographics | Rating | Rank | In Labor Force | Age 30-34 |
| Immigrants | North America | 33.3 /100 | #184 | Fair 84.6% |
| Immigrants | Philippines | 31.5 /100 | #185 | Fair 84.6% |
| Immigrants | Congo | 29.7 /100 | #186 | Fair 84.6% |
| Costa Ricans | 29.6 /100 | #187 | Fair 84.6% |
| Taiwanese | 29.4 /100 | #188 | Fair 84.6% |
| Nigerians | 28.9 /100 | #189 | Fair 84.5% |
| Immigrants | Zaire | 25.8 /100 | #190 | Fair 84.5% |
| Hungarians | 24.8 /100 | #191 | Fair 84.5% |
| Scandinavians | 24.7 /100 | #192 | Fair 84.5% |
| Immigrants | Costa Rica | 23.9 /100 | #193 | Fair 84.5% |
| Immigrants | Afghanistan | 23.5 /100 | #194 | Fair 84.5% |
| Koreans | 23.2 /100 | #195 | Fair 84.5% |
| British | 22.9 /100 | #196 | Fair 84.5% |
| Immigrants | Syria | 21.9 /100 | #197 | Fair 84.5% |
| Dutch | 20.2 /100 | #198 | Fair 84.5% |
Demographics Similar to Immigrants from Vietnam by In Labor Force | Age 30-34
In terms of in labor force | age 30-34, the demographic groups most similar to Immigrants from Vietnam are South African (85.0%, a difference of 0.020%), Sri Lankan (85.0%, a difference of 0.020%), Bhutanese (85.0%, a difference of 0.020%), Chilean (84.9%, a difference of 0.020%), and Jordanian (85.0%, a difference of 0.030%).
| Demographics | Rating | Rank | In Labor Force | Age 30-34 |
| New Zealanders | 89.5 /100 | #133 | Excellent 85.0% |
| Immigrants | Chile | 89.2 /100 | #134 | Excellent 85.0% |
| Immigrants | Asia | 88.9 /100 | #135 | Excellent 85.0% |
| Jordanians | 88.6 /100 | #136 | Excellent 85.0% |
| South Africans | 88.0 /100 | #137 | Excellent 85.0% |
| Sri Lankans | 87.8 /100 | #138 | Excellent 85.0% |
| Bhutanese | 87.5 /100 | #139 | Excellent 85.0% |
| Immigrants | Vietnam | 86.5 /100 | #140 | Excellent 85.0% |
| Chileans | 85.3 /100 | #141 | Excellent 84.9% |
| Immigrants | Indonesia | 84.3 /100 | #142 | Excellent 84.9% |
| Colombians | 82.2 /100 | #143 | Excellent 84.9% |
| Uruguayans | 78.5 /100 | #144 | Good 84.9% |
| Palestinians | 77.7 /100 | #145 | Good 84.9% |
| Immigrants | Saudi Arabia | 76.6 /100 | #146 | Good 84.9% |
| Immigrants | Colombia | 76.3 /100 | #147 | Good 84.9% |