Pennsylvania German vs Immigrants from Vietnam Disability Age 35 to 64
COMPARE
Pennsylvania German
Immigrants from Vietnam
Disability Age 35 to 64
Disability Age 35 to 64 Comparison
Pennsylvania Germans
Immigrants from Vietnam
12.8%
DISABILITY AGE 35 TO 64
0.1/ 100
METRIC RATING
273rd/ 347
METRIC RANK
10.1%
DISABILITY AGE 35 TO 64
99.3/ 100
METRIC RATING
79th/ 347
METRIC RANK
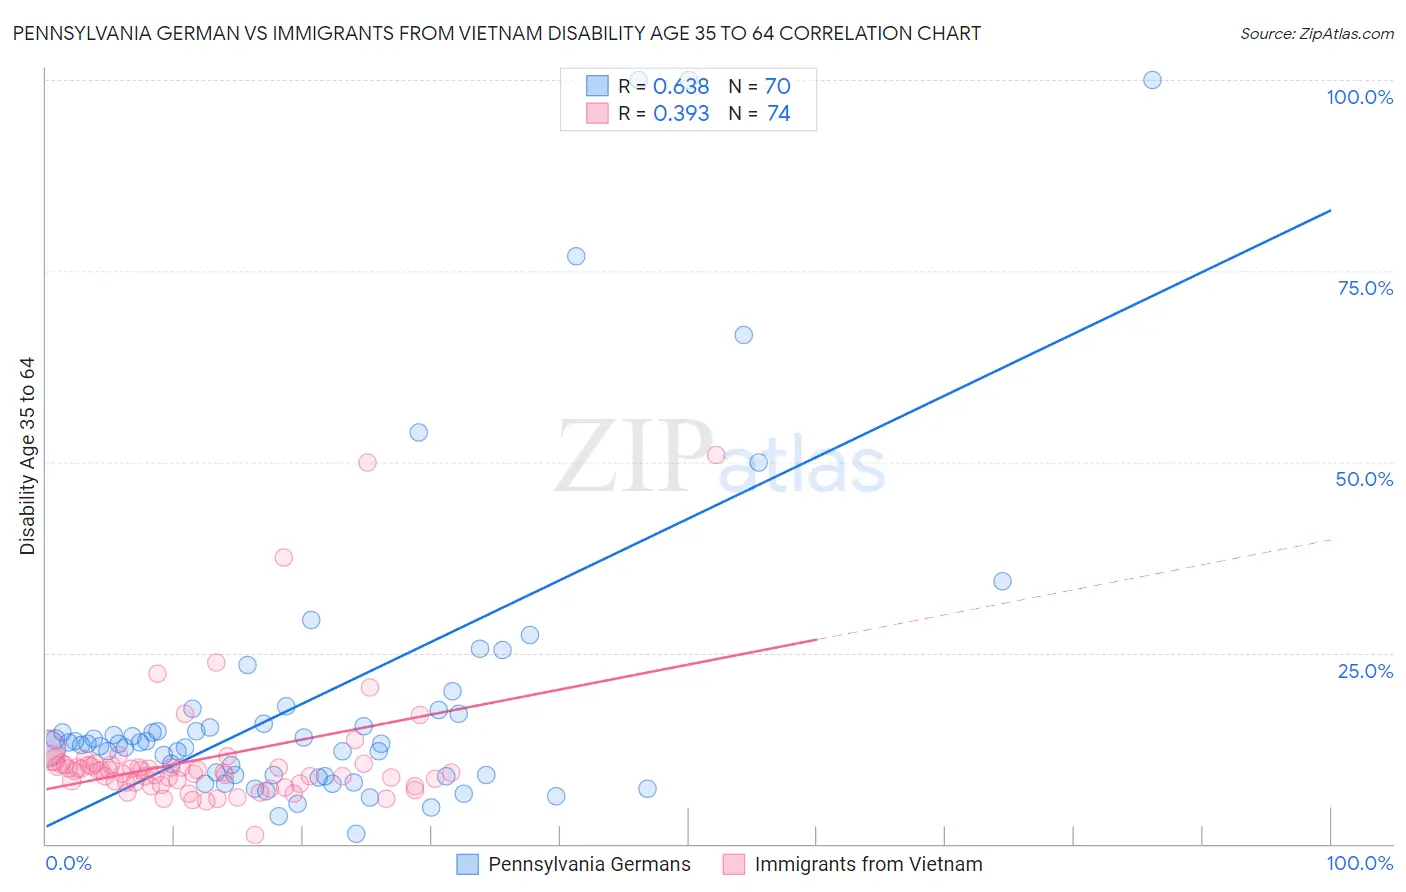
Pennsylvania German vs Immigrants from Vietnam Disability Age 35 to 64 Correlation Chart
The statistical analysis conducted on geographies consisting of 234,029,546 people shows a significant positive correlation between the proportion of Pennsylvania Germans and percentage of population with a disability between the ages 34 and 64 in the United States with a correlation coefficient (R) of 0.638 and weighted average of 12.8%. Similarly, the statistical analysis conducted on geographies consisting of 404,532,897 people shows a mild positive correlation between the proportion of Immigrants from Vietnam and percentage of population with a disability between the ages 34 and 64 in the United States with a correlation coefficient (R) of 0.393 and weighted average of 10.1%, a difference of 26.6%.
Disability Age 35 to 64 Correlation Summary
| Measurement | Pennsylvania German | Immigrants from Vietnam |
| Minimum | 1.3% | 1.1% |
| Maximum | 100.0% | 50.9% |
| Range | 98.7% | 49.8% |
| Mean | 19.5% | 11.1% |
| Median | 13.1% | 9.5% |
| Interquartile 25% (IQ1) | 9.0% | 8.0% |
| Interquartile 75% (IQ3) | 16.9% | 10.3% |
| Interquartile Range (IQR) | 8.0% | 2.4% |
| Standard Deviation (Sample) | 21.6% | 8.1% |
| Standard Deviation (Population) | 21.4% | 8.1% |
Similar Demographics by Disability Age 35 to 64
Demographics Similar to Pennsylvania Germans by Disability Age 35 to 64
In terms of disability age 35 to 64, the demographic groups most similar to Pennsylvania Germans are Celtic (12.9%, a difference of 0.030%), U.S. Virgin Islander (12.8%, a difference of 0.080%), Dominican (12.9%, a difference of 0.16%), Nepalese (12.8%, a difference of 0.21%), and Somali (12.9%, a difference of 0.28%).
| Demographics | Rating | Rank | Disability Age 35 to 64 |
| Whites/Caucasians | 0.3 /100 | #266 | Tragic 12.6% |
| Sub-Saharan Africans | 0.2 /100 | #267 | Tragic 12.6% |
| Immigrants | Dominica | 0.2 /100 | #268 | Tragic 12.7% |
| Spanish | 0.2 /100 | #269 | Tragic 12.7% |
| French | 0.2 /100 | #270 | Tragic 12.7% |
| Nepalese | 0.1 /100 | #271 | Tragic 12.8% |
| U.S. Virgin Islanders | 0.1 /100 | #272 | Tragic 12.8% |
| Pennsylvania Germans | 0.1 /100 | #273 | Tragic 12.8% |
| Celtics | 0.1 /100 | #274 | Tragic 12.9% |
| Dominicans | 0.1 /100 | #275 | Tragic 12.9% |
| Somalis | 0.1 /100 | #276 | Tragic 12.9% |
| Immigrants | Dominican Republic | 0.1 /100 | #277 | Tragic 12.9% |
| French Canadians | 0.1 /100 | #278 | Tragic 12.9% |
| Immigrants | Micronesia | 0.1 /100 | #279 | Tragic 12.9% |
| Liberians | 0.1 /100 | #280 | Tragic 12.9% |
Demographics Similar to Immigrants from Vietnam by Disability Age 35 to 64
In terms of disability age 35 to 64, the demographic groups most similar to Immigrants from Vietnam are Jordanian (10.1%, a difference of 0.070%), Immigrants from Croatia (10.2%, a difference of 0.13%), Mongolian (10.1%, a difference of 0.21%), Latvian (10.2%, a difference of 0.23%), and Immigrants from Chile (10.1%, a difference of 0.25%).
| Demographics | Rating | Rank | Disability Age 35 to 64 |
| Immigrants | Northern Europe | 99.5 /100 | #72 | Exceptional 10.1% |
| Immigrants | France | 99.5 /100 | #73 | Exceptional 10.1% |
| Laotians | 99.4 /100 | #74 | Exceptional 10.1% |
| Immigrants | Latvia | 99.4 /100 | #75 | Exceptional 10.1% |
| Immigrants | Chile | 99.4 /100 | #76 | Exceptional 10.1% |
| Mongolians | 99.4 /100 | #77 | Exceptional 10.1% |
| Jordanians | 99.3 /100 | #78 | Exceptional 10.1% |
| Immigrants | Vietnam | 99.3 /100 | #79 | Exceptional 10.1% |
| Immigrants | Croatia | 99.3 /100 | #80 | Exceptional 10.2% |
| Latvians | 99.2 /100 | #81 | Exceptional 10.2% |
| Russians | 99.2 /100 | #82 | Exceptional 10.2% |
| Immigrants | Brazil | 99.2 /100 | #83 | Exceptional 10.2% |
| Sri Lankans | 99.2 /100 | #84 | Exceptional 10.2% |
| Immigrants | Kuwait | 99.1 /100 | #85 | Exceptional 10.2% |
| Immigrants | Europe | 99.1 /100 | #86 | Exceptional 10.2% |