Tongan vs Immigrants from Vietnam In Labor Force | Age 30-34
COMPARE
Tongan
Immigrants from Vietnam
In Labor Force | Age 30-34
In Labor Force | Age 30-34 Comparison
Tongans
Immigrants from Vietnam
83.5%
IN LABOR FORCE | AGE 30-34
0.0/ 100
METRIC RATING
276th/ 347
METRIC RANK
85.0%
IN LABOR FORCE | AGE 30-34
86.5/ 100
METRIC RATING
140th/ 347
METRIC RANK
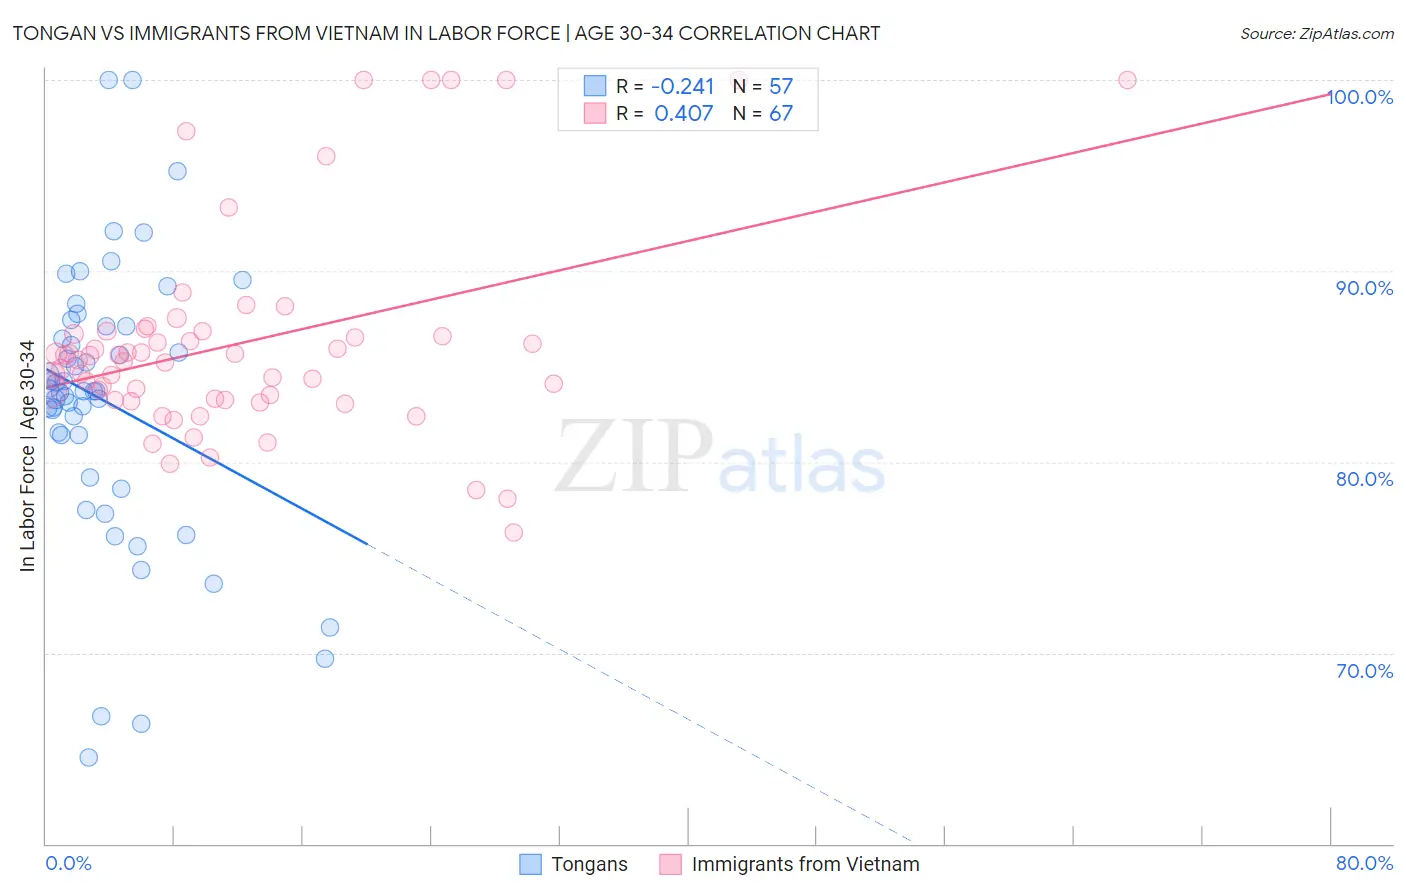
Tongan vs Immigrants from Vietnam In Labor Force | Age 30-34 Correlation Chart
The statistical analysis conducted on geographies consisting of 102,882,684 people shows a weak negative correlation between the proportion of Tongans and labor force participation rate among population between the ages 30 and 34 in the United States with a correlation coefficient (R) of -0.241 and weighted average of 83.5%. Similarly, the statistical analysis conducted on geographies consisting of 404,594,648 people shows a moderate positive correlation between the proportion of Immigrants from Vietnam and labor force participation rate among population between the ages 30 and 34 in the United States with a correlation coefficient (R) of 0.407 and weighted average of 85.0%, a difference of 1.8%.
In Labor Force | Age 30-34 Correlation Summary
| Measurement | Tongan | Immigrants from Vietnam |
| Minimum | 64.5% | 76.3% |
| Maximum | 100.0% | 100.0% |
| Range | 35.5% | 23.7% |
| Mean | 83.2% | 86.2% |
| Median | 83.7% | 85.3% |
| Interquartile 25% (IQ1) | 80.3% | 83.3% |
| Interquartile 75% (IQ3) | 87.1% | 86.8% |
| Interquartile Range (IQR) | 6.8% | 3.6% |
| Standard Deviation (Sample) | 7.2% | 5.5% |
| Standard Deviation (Population) | 7.1% | 5.4% |
Similar Demographics by In Labor Force | Age 30-34
Demographics Similar to Tongans by In Labor Force | Age 30-34
In terms of in labor force | age 30-34, the demographic groups most similar to Tongans are Immigrants from Grenada (83.5%, a difference of 0.010%), Guamanian/Chamorro (83.5%, a difference of 0.020%), Belizean (83.5%, a difference of 0.020%), Delaware (83.5%, a difference of 0.020%), and Fijian (83.4%, a difference of 0.070%).
| Demographics | Rating | Rank | In Labor Force | Age 30-34 |
| Vietnamese | 0.1 /100 | #269 | Tragic 83.6% |
| Spanish Americans | 0.0 /100 | #270 | Tragic 83.5% |
| Spanish | 0.0 /100 | #271 | Tragic 83.5% |
| Immigrants | Nonimmigrants | 0.0 /100 | #272 | Tragic 83.5% |
| Guamanians/Chamorros | 0.0 /100 | #273 | Tragic 83.5% |
| Belizeans | 0.0 /100 | #274 | Tragic 83.5% |
| Immigrants | Grenada | 0.0 /100 | #275 | Tragic 83.5% |
| Tongans | 0.0 /100 | #276 | Tragic 83.5% |
| Delaware | 0.0 /100 | #277 | Tragic 83.5% |
| Fijians | 0.0 /100 | #278 | Tragic 83.4% |
| Immigrants | Fiji | 0.0 /100 | #279 | Tragic 83.4% |
| Africans | 0.0 /100 | #280 | Tragic 83.4% |
| Samoans | 0.0 /100 | #281 | Tragic 83.3% |
| Mexican American Indians | 0.0 /100 | #282 | Tragic 83.2% |
| Assyrians/Chaldeans/Syriacs | 0.0 /100 | #283 | Tragic 83.2% |
Demographics Similar to Immigrants from Vietnam by In Labor Force | Age 30-34
In terms of in labor force | age 30-34, the demographic groups most similar to Immigrants from Vietnam are South African (85.0%, a difference of 0.020%), Sri Lankan (85.0%, a difference of 0.020%), Bhutanese (85.0%, a difference of 0.020%), Chilean (84.9%, a difference of 0.020%), and Jordanian (85.0%, a difference of 0.030%).
| Demographics | Rating | Rank | In Labor Force | Age 30-34 |
| New Zealanders | 89.5 /100 | #133 | Excellent 85.0% |
| Immigrants | Chile | 89.2 /100 | #134 | Excellent 85.0% |
| Immigrants | Asia | 88.9 /100 | #135 | Excellent 85.0% |
| Jordanians | 88.6 /100 | #136 | Excellent 85.0% |
| South Africans | 88.0 /100 | #137 | Excellent 85.0% |
| Sri Lankans | 87.8 /100 | #138 | Excellent 85.0% |
| Bhutanese | 87.5 /100 | #139 | Excellent 85.0% |
| Immigrants | Vietnam | 86.5 /100 | #140 | Excellent 85.0% |
| Chileans | 85.3 /100 | #141 | Excellent 84.9% |
| Immigrants | Indonesia | 84.3 /100 | #142 | Excellent 84.9% |
| Colombians | 82.2 /100 | #143 | Excellent 84.9% |
| Uruguayans | 78.5 /100 | #144 | Good 84.9% |
| Palestinians | 77.7 /100 | #145 | Good 84.9% |
| Immigrants | Saudi Arabia | 76.6 /100 | #146 | Good 84.9% |
| Immigrants | Colombia | 76.3 /100 | #147 | Good 84.9% |