Pennsylvania German vs Immigrants from Dominican Republic In Labor Force | Age 30-34

COMPARE

Pennsylvania German
Race
Ancestry
AfghanAfricanAlaska NativeAlaskan AthabascanAlbanianAleutAlsatianAmericanApacheArabArapahoArgentineanArmenianAssyrian/Chaldean/SyriacAustralianAustrianBahamianBangladeshiBarbadianBasqueBelgianBelizeanBermudanBhutaneseBlackfeetBolivianBrazilianBritishBritish West IndianBulgarianBurmeseCajunCambodianCanadianCape VerdeanCarpatho RusynCelticCentral AmericanCentral American IndianCherokeeCheyenneChickasawChileanChineseChippewaChoctawColombianColvilleComancheCosta RicanCreeCreekCroatianCrowCubanCypriotCzechCzechoslovakianDanishDelawareDominicanDutchDutch West IndianEastern EuropeanEcuadorianEgyptianEnglishEstonianEthiopianEuropeanFijianFilipinoFinnishFrenchFrench American IndianFrench CanadianGermanGerman RussianGhanaianGreekGuamanian/ChamorroGuatemalanGuyaneseHaitianHmongHonduranHopiHoumaHungarianIcelanderIndian (Asian)IndonesianInupiatIranianIraqiIrishIroquoisIsraeliItalianJamaicanJapaneseJordanianKenyanKiowaKoreanLaotianLatvianLebaneseLiberianLithuanianLumbeeLuxembourgerMacedonianMalaysianMalteseMarshalleseMenomineeMexicanMexican American IndianMongolianMoroccanNative HawaiianNavajoNepaleseNew ZealanderNicaraguanNigerianNorthern EuropeanNorwegianOkinawanOsageOttawaPaiutePakistaniPalestinianPanamanianParaguayanPennsylvania GermanPeruvianPimaPolishPortuguesePotawatomiPuebloPuerto RicanPuget Sound SalishRomanianRussianSalvadoranSamoanScandinavianScotch-IrishScottishSeminoleSenegaleseSerbianShoshoneSierra LeoneanSiouxSlavicSlovakSloveneSomaliSouth AfricanSouth AmericanSouth American IndianSoviet UnionSpaniardSpanishSpanish AmericanSpanish American IndianSri LankanSubsaharan AfricanSudaneseSwedishSwissSyrianTaiwaneseThaiTlingit-HaidaTohono O'OdhamTonganTrinidadian and TobagonianTsimshianTurkishU.S. Virgin IslanderUgandanUkrainianUruguayanUteVenezuelanVietnameseWelshWest IndianYakamaYaquiYugoslavianYumanYup'ikZimbabwean
Immigration
NonimmigrantsImmigrantsAfghanistanAfricaAlbaniaArgentinaArmeniaAsiaAustraliaAustriaBahamasBangladeshBarbadosBelarusBelgiumBelizeBoliviaBosnia and HerzegovinaBrazilBulgariaBurma/MyanmarCabo VerdeCambodiaCameroonCanadaCaribbeanCentral AmericaChileChinaColombiaCongoCosta RicaCroatiaCubaCzechoslovakiaDenmarkDominicaEastern AfricaEastern AsiaEastern EuropeEcuadorEgyptEl SalvadorEnglandEritreaEthiopiaEuropeFijiFranceGermanyGhanaGreeceGrenadaGuatemalaGuyanaHaitiHondurasHong KongHungaryIndiaIndonesiaIranIraqIrelandIsraelItalyJamaicaJapanJordanKazakhstanKenyaKoreaKuwaitLaosLatin AmericaLatviaLebanonLiberiaLithuaniaMalaysiaMexicoMicronesiaMiddle AfricaMoldovaMoroccoNepalNetherlandsNicaraguaNigeriaNorth AmericaNorth MacedoniaNorthern AfricaNorthern EuropeNorwayOceaniaPakistanPanamaPeruPhilippinesPolandPortugalRomaniaRussiaSaudi ArabiaScotlandSenegalSerbiaSierra LeoneSingaporeSomaliaSouth AfricaSouth AmericaSouth Central AsiaSouth Eastern AsiaSouthern EuropeSpainSri LankaSt. Vincent and the GrenadinesSudanSwedenSwitzerlandSyriaTaiwanThailandTrinidad and TobagoTurkeyUgandaUkraineUruguayUzbekistanVenezuelaVietnamWest IndiesWestern AfricaWestern AsiaWestern EuropeYemenZaireZimbabweAzores
Immigrants from Dominican Republic
Race
Ancestry
AfghanAfricanAlaska NativeAlaskan AthabascanAlbanianAleutAlsatianAmericanApacheArabArapahoArgentineanArmenianAssyrian/Chaldean/SyriacAustralianAustrianBahamianBangladeshiBarbadianBasqueBelgianBelizeanBermudanBhutaneseBlackfeetBolivianBrazilianBritishBritish West IndianBulgarianBurmeseCajunCambodianCanadianCape VerdeanCarpatho RusynCelticCentral AmericanCentral American IndianCherokeeCheyenneChickasawChileanChineseChippewaChoctawColombianColvilleComancheCosta RicanCreeCreekCroatianCrowCubanCypriotCzechCzechoslovakianDanishDelawareDominicanDutchDutch West IndianEastern EuropeanEcuadorianEgyptianEnglishEstonianEthiopianEuropeanFijianFilipinoFinnishFrenchFrench American IndianFrench CanadianGermanGerman RussianGhanaianGreekGuamanian/ChamorroGuatemalanGuyaneseHaitianHmongHonduranHopiHoumaHungarianIcelanderIndian (Asian)IndonesianInupiatIranianIraqiIrishIroquoisIsraeliItalianJamaicanJapaneseJordanianKenyanKiowaKoreanLaotianLatvianLebaneseLiberianLithuanianLumbeeLuxembourgerMacedonianMalaysianMalteseMarshalleseMenomineeMexicanMexican American IndianMongolianMoroccanNative HawaiianNavajoNepaleseNew ZealanderNicaraguanNigerianNorthern EuropeanNorwegianOkinawanOsageOttawaPaiutePakistaniPalestinianPanamanianParaguayanPeruvianPimaPolishPortuguesePotawatomiPuebloPuerto RicanPuget Sound SalishRomanianRussianSalvadoranSamoanScandinavianScotch-IrishScottishSeminoleSenegaleseSerbianShoshoneSierra LeoneanSiouxSlavicSlovakSloveneSomaliSouth AfricanSouth AmericanSouth American IndianSoviet UnionSpaniardSpanishSpanish AmericanSpanish American IndianSri LankanSubsaharan AfricanSudaneseSwedishSwissSyrianTaiwaneseThaiTlingit-HaidaTohono O'OdhamTonganTrinidadian and TobagonianTsimshianTurkishU.S. Virgin IslanderUgandanUkrainianUruguayanUteVenezuelanVietnameseWelshWest IndianYakamaYaquiYugoslavianYumanYup'ikZimbabwean
Immigration
NonimmigrantsImmigrantsAfghanistanAfricaAlbaniaArgentinaArmeniaAsiaAustraliaAustriaBahamasBangladeshBarbadosBelarusBelgiumBelizeBoliviaBosnia and HerzegovinaBrazilBulgariaBurma/MyanmarCabo VerdeCambodiaCameroonCanadaCaribbeanCentral AmericaChileChinaColombiaCongoCosta RicaCroatiaCubaCzechoslovakiaDenmarkDominicaDominican RepublicEastern AfricaEastern AsiaEastern EuropeEcuadorEgyptEl SalvadorEnglandEritreaEthiopiaEuropeFijiFranceGermanyGhanaGreeceGrenadaGuatemalaGuyanaHaitiHondurasHong KongHungaryIndiaIndonesiaIranIraqIrelandIsraelItalyJamaicaJapanJordanKazakhstanKenyaKoreaKuwaitLaosLatin AmericaLatviaLebanonLiberiaLithuaniaMalaysiaMexicoMicronesiaMiddle AfricaMoldovaMoroccoNepalNetherlandsNicaraguaNigeriaNorth AmericaNorth MacedoniaNorthern AfricaNorthern EuropeNorwayOceaniaPakistanPanamaPeruPhilippinesPolandPortugalRomaniaRussiaSaudi ArabiaScotlandSenegalSerbiaSierra LeoneSingaporeSomaliaSouth AfricaSouth AmericaSouth Central AsiaSouth Eastern AsiaSouthern EuropeSpainSri LankaSt. Vincent and the GrenadinesSudanSwedenSwitzerlandSyriaTaiwanThailandTrinidad and TobagoTurkeyUgandaUkraineUruguayUzbekistanVenezuelaVietnamWest IndiesWestern AfricaWestern AsiaWestern EuropeYemenZaireZimbabweAzores
In Labor Force | Age 30-34
Income
Poverty
Unemployment
Labor Participation
Family Structure
Vehicle Availability
Education Level
Disability

In Labor Force | Age 30-34 Comparison

Pennsylvania Germans

Immigrants from Dominican Republic

Tragic
Tragic
82.6%
IN LABOR FORCE | AGE 30-34
0.0/ 100
METRIC RATING
295th/ 347
METRIC RANK
83.8%
IN LABOR FORCE | AGE 30-34
0.3/ 100
METRIC RATING
260th/ 347
METRIC RANK

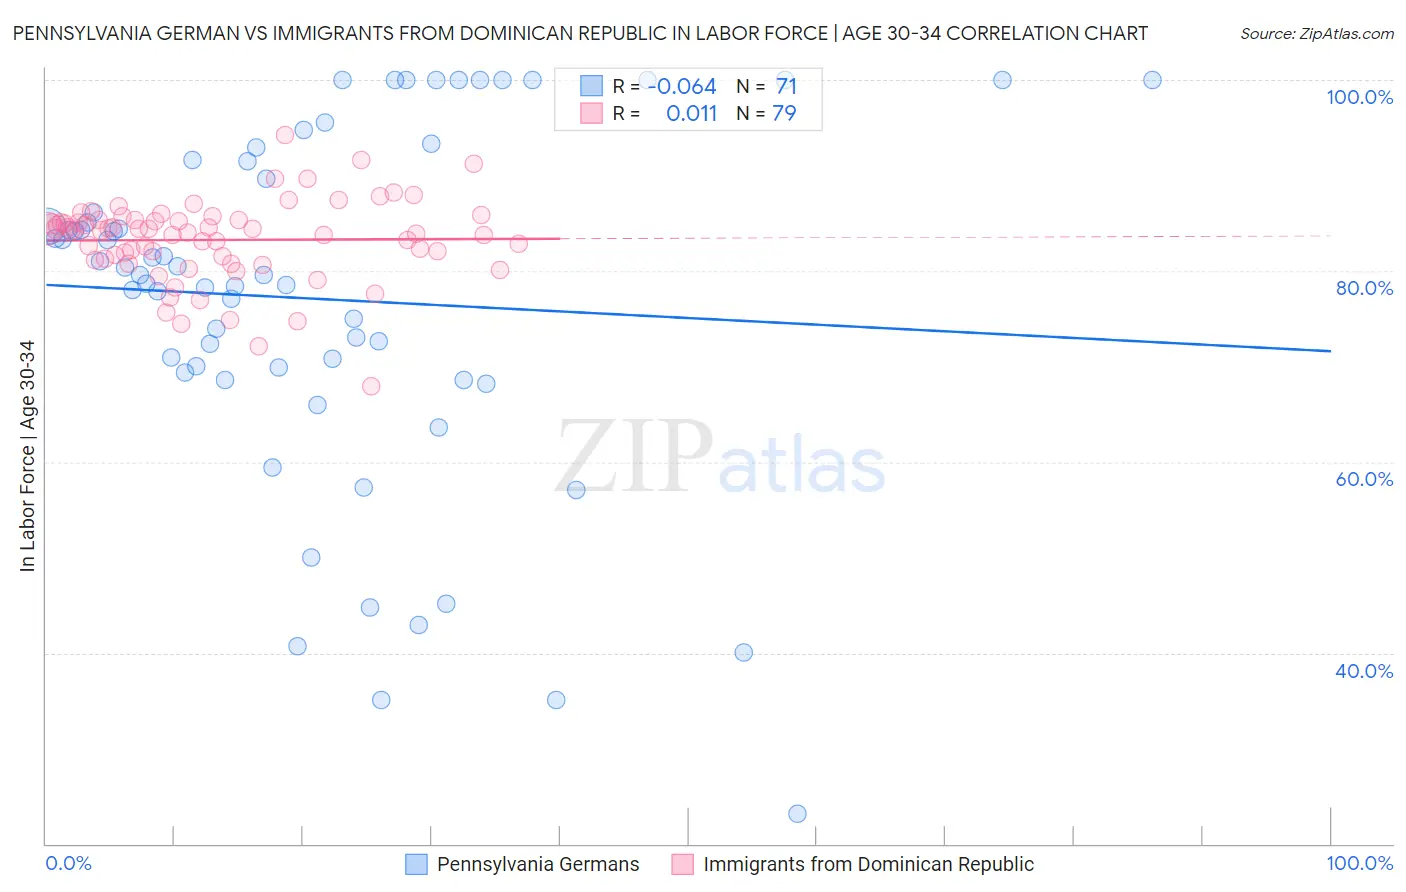
Pennsylvania German vs Immigrants from Dominican Republic In Labor Force | Age 30-34 Correlation Chart

The statistical analysis conducted on geographies consisting of 233,986,742 people shows a slight negative correlation between the proportion of Pennsylvania Germans and labor force participation rate among population between the ages 30 and 34 in the United States with a correlation coefficient (R) of -0.064 and weighted average of 82.6%. Similarly, the statistical analysis conducted on geographies consisting of 274,867,457 people shows no correlation between the proportion of Immigrants from Dominican Republic and labor force participation rate among population between the ages 30 and 34 in the United States with a correlation coefficient (R) of 0.011 and weighted average of 83.8%, a difference of 1.5%.
Pennsylvania German vs Immigrants from Dominican Republic In Labor Force | Age 30-34

In Labor Force | Age 30-34 Correlation Summary

MeasurementPennsylvania GermanImmigrants from Dominican Republic
Minimum23.2%67.9%
Maximum100.0%94.2%
Range76.8%26.3%
Mean77.1%83.3%
Median79.6%84.2%
Interquartile 25% (IQ1)69.4%81.2%
Interquartile 75% (IQ3)91.4%85.3%
Interquartile Range (IQR)22.0%4.1%
Standard Deviation (Sample)18.4%4.3%
Standard Deviation (Population)18.3%4.3%

Similar Demographics by In Labor Force | Age 30-34

Demographics Similar to Pennsylvania Germans by In Labor Force | Age 30-34

In terms of in labor force | age 30-34, the demographic groups most similar to Pennsylvania Germans are Chippewa (82.6%, a difference of 0.020%), Comanche (82.6%, a difference of 0.030%), Aleut (82.6%, a difference of 0.030%), American (82.7%, a difference of 0.12%), and Nepalese (82.7%, a difference of 0.14%).
DemographicsRating | RankIn Labor Force | Age 30-34
Central American Indians
0.0
/100
|
#288
Tragic
83.0%
Hawaiians
0.0
/100
|
#289
Tragic
83.0%
Blackfeet
0.0
/100
|
#290
Tragic
82.8%
Potawatomi
0.0
/100
|
#291
Tragic
82.8%
Blacks/African Americans
0.0
/100
|
#292
Tragic
82.8%
Nepalese
0.0
/100
|
#293
Tragic
82.7%
Americans
0.0
/100
|
#294
Tragic
82.7%
Pennsylvania Germans
0.0
/100
|
#295
Tragic
82.6%
Chippewa
0.0
/100
|
#296
Tragic
82.6%
Comanche
0.0
/100
|
#297
Tragic
82.6%
Aleuts
0.0
/100
|
#298
Tragic
82.6%
Immigrants | Central America
0.0
/100
|
#299
Tragic
82.5%
Hmong
0.0
/100
|
#300
Tragic
82.4%
Hispanics or Latinos
0.0
/100
|
#301
Tragic
82.4%
Ottawa
0.0
/100
|
#302
Tragic
82.4%

Demographics Similar to Immigrants from Dominican Republic by In Labor Force | Age 30-34

In terms of in labor force | age 30-34, the demographic groups most similar to Immigrants from Dominican Republic are Guyanese (83.8%, a difference of 0.010%), Honduran (83.8%, a difference of 0.020%), Scotch-Irish (83.8%, a difference of 0.020%), Dominican (83.8%, a difference of 0.020%), and Immigrants from Guyana (83.8%, a difference of 0.030%).
DemographicsRating | RankIn Labor Force | Age 30-34
Immigrants | Nicaragua
0.6
/100
|
#253
Tragic
83.9%
Immigrants | St. Vincent and the Grenadines
0.5
/100
|
#254
Tragic
83.9%
Whites/Caucasians
0.5
/100
|
#255
Tragic
83.9%
Immigrants | Lebanon
0.4
/100
|
#256
Tragic
83.9%
Iraqis
0.3
/100
|
#257
Tragic
83.8%
Hondurans
0.3
/100
|
#258
Tragic
83.8%
Scotch-Irish
0.3
/100
|
#259
Tragic
83.8%
Immigrants | Dominican Republic
0.3
/100
|
#260
Tragic
83.8%
Guyanese
0.3
/100
|
#261
Tragic
83.8%
Dominicans
0.2
/100
|
#262
Tragic
83.8%
Immigrants | Guyana
0.2
/100
|
#263
Tragic
83.8%
Guatemalans
0.2
/100
|
#264
Tragic
83.7%
Immigrants | Honduras
0.1
/100
|
#265
Tragic
83.7%
Immigrants | Guatemala
0.1
/100
|
#266
Tragic
83.7%
Spaniards
0.1
/100
|
#267
Tragic
83.6%