Scottish vs Immigrants from Cuba In Labor Force | Age 35-44
COMPARE
Scottish
Immigrants from Cuba
In Labor Force | Age 35-44
In Labor Force | Age 35-44 Comparison
Scottish
Immigrants from Cuba
83.9%
IN LABOR FORCE | AGE 35-44
3.2/ 100
METRIC RATING
231st/ 347
METRIC RANK
84.9%
IN LABOR FORCE | AGE 35-44
98.6/ 100
METRIC RATING
76th/ 347
METRIC RANK
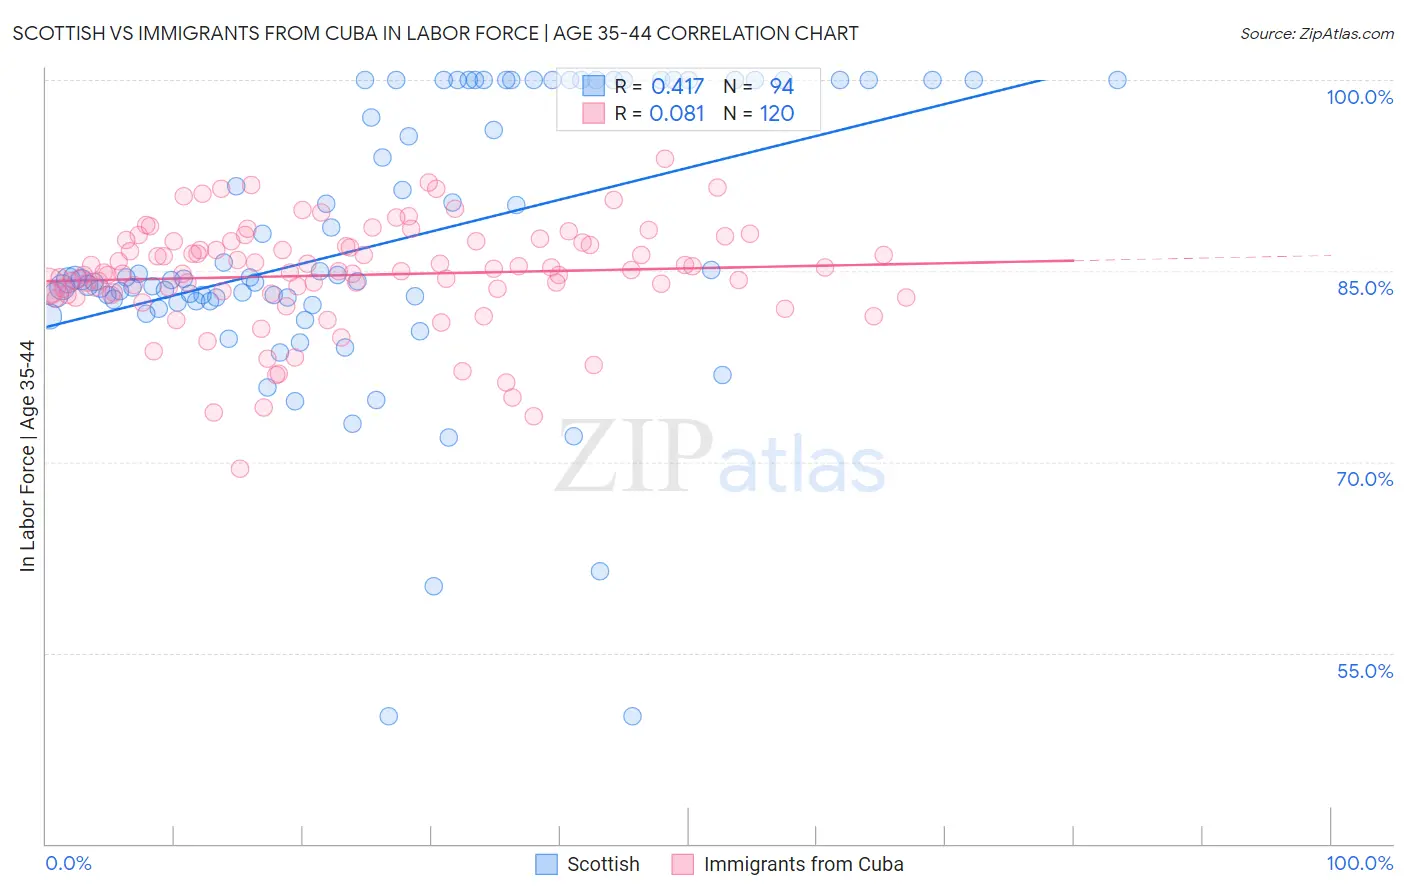
Scottish vs Immigrants from Cuba In Labor Force | Age 35-44 Correlation Chart
The statistical analysis conducted on geographies consisting of 566,464,566 people shows a moderate positive correlation between the proportion of Scottish and labor force participation rate among population between the ages 35 and 44 in the United States with a correlation coefficient (R) of 0.417 and weighted average of 83.9%. Similarly, the statistical analysis conducted on geographies consisting of 325,923,342 people shows a slight positive correlation between the proportion of Immigrants from Cuba and labor force participation rate among population between the ages 35 and 44 in the United States with a correlation coefficient (R) of 0.081 and weighted average of 84.9%, a difference of 1.3%.
In Labor Force | Age 35-44 Correlation Summary
| Measurement | Scottish | Immigrants from Cuba |
| Minimum | 50.0% | 69.5% |
| Maximum | 100.0% | 93.8% |
| Range | 50.0% | 24.3% |
| Mean | 87.1% | 84.7% |
| Median | 84.4% | 85.0% |
| Interquartile 25% (IQ1) | 82.6% | 83.2% |
| Interquartile 75% (IQ3) | 100.0% | 87.3% |
| Interquartile Range (IQR) | 17.4% | 4.0% |
| Standard Deviation (Sample) | 10.9% | 4.2% |
| Standard Deviation (Population) | 10.8% | 4.1% |
Similar Demographics by In Labor Force | Age 35-44
Demographics Similar to Scottish by In Labor Force | Age 35-44
In terms of in labor force | age 35-44, the demographic groups most similar to Scottish are Native Hawaiian (83.9%, a difference of 0.010%), Immigrants from Germany (83.9%, a difference of 0.020%), Immigrants from Iraq (83.9%, a difference of 0.030%), Immigrants from Oceania (83.9%, a difference of 0.030%), and Immigrants from Syria (83.9%, a difference of 0.040%).
| Demographics | Rating | Rank | In Labor Force | Age 35-44 |
| U.S. Virgin Islanders | 6.1 /100 | #224 | Tragic 84.0% |
| Immigrants | Burma/Myanmar | 6.1 /100 | #225 | Tragic 84.0% |
| Panamanians | 5.4 /100 | #226 | Tragic 84.0% |
| British West Indians | 5.3 /100 | #227 | Tragic 84.0% |
| Welsh | 5.3 /100 | #228 | Tragic 84.0% |
| Immigrants | Thailand | 4.7 /100 | #229 | Tragic 84.0% |
| Immigrants | Iraq | 3.7 /100 | #230 | Tragic 83.9% |
| Scottish | 3.2 /100 | #231 | Tragic 83.9% |
| Native Hawaiians | 3.0 /100 | #232 | Tragic 83.9% |
| Immigrants | Germany | 2.8 /100 | #233 | Tragic 83.9% |
| Immigrants | Oceania | 2.6 /100 | #234 | Tragic 83.9% |
| Immigrants | Syria | 2.5 /100 | #235 | Tragic 83.9% |
| West Indians | 2.4 /100 | #236 | Tragic 83.9% |
| English | 1.8 /100 | #237 | Tragic 83.8% |
| Immigrants | Laos | 1.7 /100 | #238 | Tragic 83.8% |
Demographics Similar to Immigrants from Cuba by In Labor Force | Age 35-44
In terms of in labor force | age 35-44, the demographic groups most similar to Immigrants from Cuba are Immigrants from Turkey (84.9%, a difference of 0.0%), Immigrants from South Central Asia (85.0%, a difference of 0.010%), Colombian (85.0%, a difference of 0.020%), Immigrants from Singapore (85.0%, a difference of 0.030%), and Immigrants from Sri Lanka (85.0%, a difference of 0.030%).
| Demographics | Rating | Rank | In Labor Force | Age 35-44 |
| Sudanese | 99.0 /100 | #69 | Exceptional 85.0% |
| Brazilians | 99.0 /100 | #70 | Exceptional 85.0% |
| Russians | 99.0 /100 | #71 | Exceptional 85.0% |
| Immigrants | Singapore | 98.9 /100 | #72 | Exceptional 85.0% |
| Immigrants | Sri Lanka | 98.9 /100 | #73 | Exceptional 85.0% |
| Colombians | 98.8 /100 | #74 | Exceptional 85.0% |
| Immigrants | South Central Asia | 98.7 /100 | #75 | Exceptional 85.0% |
| Immigrants | Cuba | 98.6 /100 | #76 | Exceptional 84.9% |
| Immigrants | Turkey | 98.6 /100 | #77 | Exceptional 84.9% |
| Immigrants | Africa | 98.4 /100 | #78 | Exceptional 84.9% |
| Peruvians | 98.3 /100 | #79 | Exceptional 84.9% |
| Immigrants | Colombia | 98.3 /100 | #80 | Exceptional 84.9% |
| Immigrants | Eastern Europe | 98.3 /100 | #81 | Exceptional 84.9% |
| Immigrants | Sudan | 98.1 /100 | #82 | Exceptional 84.9% |
| Senegalese | 97.8 /100 | #83 | Exceptional 84.9% |