Nigerian vs Immigrants from Cuba In Labor Force | Age 35-44
COMPARE
Nigerian
Immigrants from Cuba
In Labor Force | Age 35-44
In Labor Force | Age 35-44 Comparison
Nigerians
Immigrants from Cuba
84.4%
IN LABOR FORCE | AGE 35-44
58.9/ 100
METRIC RATING
164th/ 347
METRIC RANK
84.9%
IN LABOR FORCE | AGE 35-44
98.6/ 100
METRIC RATING
76th/ 347
METRIC RANK
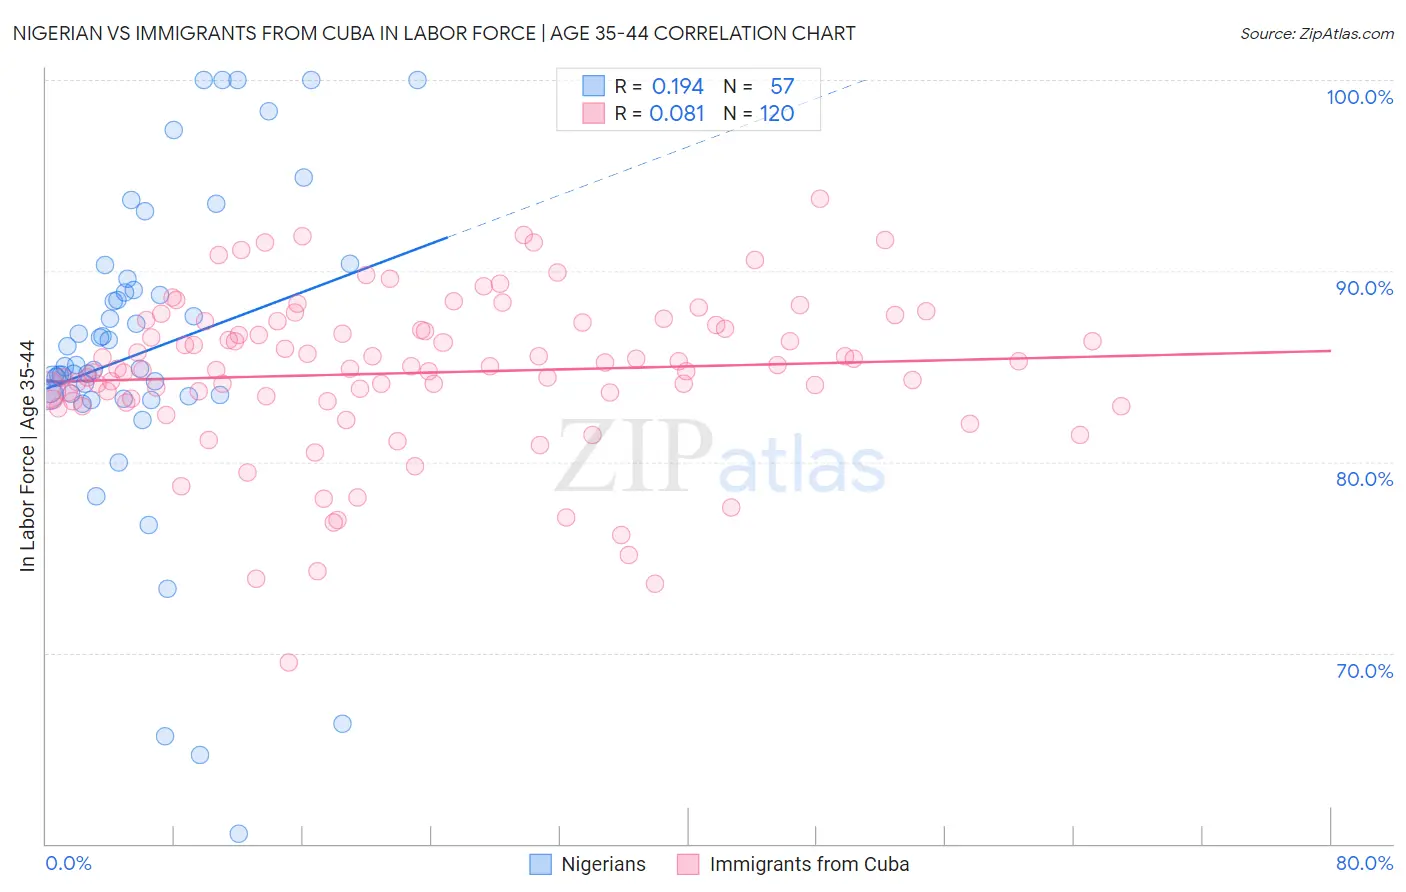
Nigerian vs Immigrants from Cuba In Labor Force | Age 35-44 Correlation Chart
The statistical analysis conducted on geographies consisting of 332,557,673 people shows a poor positive correlation between the proportion of Nigerians and labor force participation rate among population between the ages 35 and 44 in the United States with a correlation coefficient (R) of 0.194 and weighted average of 84.4%. Similarly, the statistical analysis conducted on geographies consisting of 325,923,342 people shows a slight positive correlation between the proportion of Immigrants from Cuba and labor force participation rate among population between the ages 35 and 44 in the United States with a correlation coefficient (R) of 0.081 and weighted average of 84.9%, a difference of 0.63%.
In Labor Force | Age 35-44 Correlation Summary
| Measurement | Nigerian | Immigrants from Cuba |
| Minimum | 60.5% | 69.5% |
| Maximum | 100.0% | 93.8% |
| Range | 39.5% | 24.3% |
| Mean | 85.8% | 84.7% |
| Median | 85.0% | 85.0% |
| Interquartile 25% (IQ1) | 83.4% | 83.2% |
| Interquartile 75% (IQ3) | 89.3% | 87.3% |
| Interquartile Range (IQR) | 5.9% | 4.0% |
| Standard Deviation (Sample) | 8.4% | 4.2% |
| Standard Deviation (Population) | 8.3% | 4.1% |
Similar Demographics by In Labor Force | Age 35-44
Demographics Similar to Nigerians by In Labor Force | Age 35-44
In terms of in labor force | age 35-44, the demographic groups most similar to Nigerians are Immigrants from Hungary (84.4%, a difference of 0.0%), Aleut (84.4%, a difference of 0.0%), Immigrants from Senegal (84.4%, a difference of 0.010%), Immigrants from Kazakhstan (84.4%, a difference of 0.010%), and Immigrants from Venezuela (84.4%, a difference of 0.010%).
| Demographics | Rating | Rank | In Labor Force | Age 35-44 |
| Immigrants | Austria | 63.8 /100 | #157 | Good 84.4% |
| Jamaicans | 62.7 /100 | #158 | Good 84.4% |
| Immigrants | Senegal | 60.4 /100 | #159 | Good 84.4% |
| Immigrants | Kazakhstan | 60.4 /100 | #160 | Good 84.4% |
| Immigrants | Venezuela | 60.0 /100 | #161 | Good 84.4% |
| Immigrants | Hungary | 59.4 /100 | #162 | Average 84.4% |
| Aleuts | 59.1 /100 | #163 | Average 84.4% |
| Nigerians | 58.9 /100 | #164 | Average 84.4% |
| Venezuelans | 58.1 /100 | #165 | Average 84.4% |
| Alsatians | 55.2 /100 | #166 | Average 84.4% |
| Immigrants | Portugal | 55.2 /100 | #167 | Average 84.4% |
| Irish | 53.1 /100 | #168 | Average 84.4% |
| Immigrants | Afghanistan | 52.7 /100 | #169 | Average 84.4% |
| Immigrants | Jordan | 52.5 /100 | #170 | Average 84.4% |
| Jordanians | 51.7 /100 | #171 | Average 84.4% |
Demographics Similar to Immigrants from Cuba by In Labor Force | Age 35-44
In terms of in labor force | age 35-44, the demographic groups most similar to Immigrants from Cuba are Immigrants from Turkey (84.9%, a difference of 0.0%), Immigrants from South Central Asia (85.0%, a difference of 0.010%), Colombian (85.0%, a difference of 0.020%), Immigrants from Singapore (85.0%, a difference of 0.030%), and Immigrants from Sri Lanka (85.0%, a difference of 0.030%).
| Demographics | Rating | Rank | In Labor Force | Age 35-44 |
| Sudanese | 99.0 /100 | #69 | Exceptional 85.0% |
| Brazilians | 99.0 /100 | #70 | Exceptional 85.0% |
| Russians | 99.0 /100 | #71 | Exceptional 85.0% |
| Immigrants | Singapore | 98.9 /100 | #72 | Exceptional 85.0% |
| Immigrants | Sri Lanka | 98.9 /100 | #73 | Exceptional 85.0% |
| Colombians | 98.8 /100 | #74 | Exceptional 85.0% |
| Immigrants | South Central Asia | 98.7 /100 | #75 | Exceptional 85.0% |
| Immigrants | Cuba | 98.6 /100 | #76 | Exceptional 84.9% |
| Immigrants | Turkey | 98.6 /100 | #77 | Exceptional 84.9% |
| Immigrants | Africa | 98.4 /100 | #78 | Exceptional 84.9% |
| Peruvians | 98.3 /100 | #79 | Exceptional 84.9% |
| Immigrants | Colombia | 98.3 /100 | #80 | Exceptional 84.9% |
| Immigrants | Eastern Europe | 98.3 /100 | #81 | Exceptional 84.9% |
| Immigrants | Sudan | 98.1 /100 | #82 | Exceptional 84.9% |
| Senegalese | 97.8 /100 | #83 | Exceptional 84.9% |