American vs Czech In Labor Force | Age 35-44
COMPARE
American
Czech
In Labor Force | Age 35-44
In Labor Force | Age 35-44 Comparison
Americans
Czechs
82.4%
IN LABOR FORCE | AGE 35-44
0.0/ 100
METRIC RATING
302nd/ 347
METRIC RANK
85.3%
IN LABOR FORCE | AGE 35-44
99.9/ 100
METRIC RATING
31st/ 347
METRIC RANK
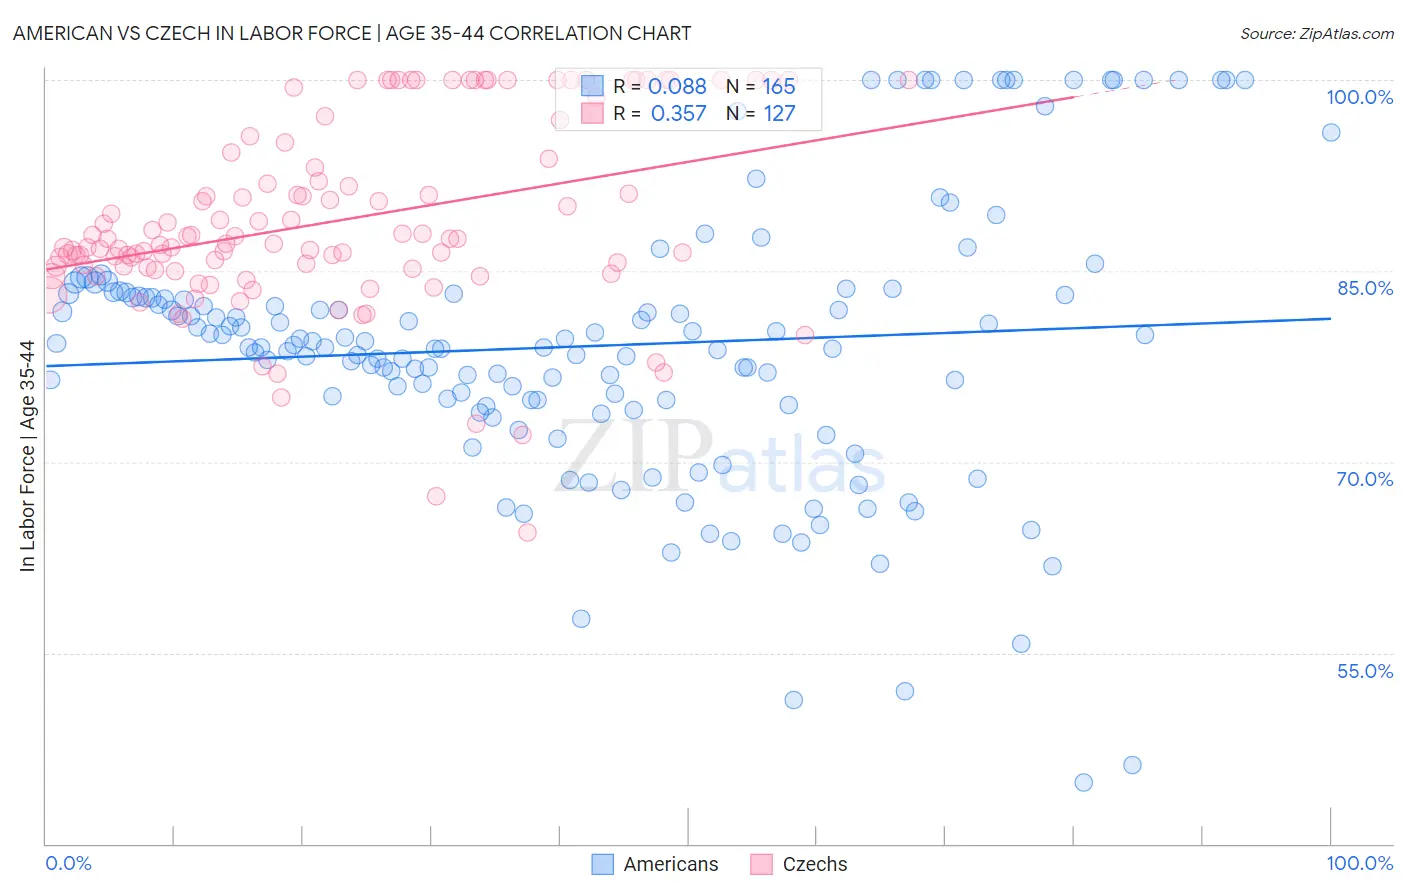
American vs Czech In Labor Force | Age 35-44 Correlation Chart
The statistical analysis conducted on geographies consisting of 581,120,532 people shows a slight positive correlation between the proportion of Americans and labor force participation rate among population between the ages 35 and 44 in the United States with a correlation coefficient (R) of 0.088 and weighted average of 82.4%. Similarly, the statistical analysis conducted on geographies consisting of 484,520,420 people shows a mild positive correlation between the proportion of Czechs and labor force participation rate among population between the ages 35 and 44 in the United States with a correlation coefficient (R) of 0.357 and weighted average of 85.3%, a difference of 3.5%.
In Labor Force | Age 35-44 Correlation Summary
| Measurement | American | Czech |
| Minimum | 44.8% | 64.5% |
| Maximum | 100.0% | 100.0% |
| Range | 55.2% | 35.5% |
| Mean | 79.1% | 89.0% |
| Median | 79.0% | 87.1% |
| Interquartile 25% (IQ1) | 74.7% | 85.2% |
| Interquartile 75% (IQ3) | 83.2% | 94.3% |
| Interquartile Range (IQR) | 8.5% | 9.1% |
| Standard Deviation (Sample) | 10.7% | 7.4% |
| Standard Deviation (Population) | 10.7% | 7.4% |
Similar Demographics by In Labor Force | Age 35-44
Demographics Similar to Americans by In Labor Force | Age 35-44
In terms of in labor force | age 35-44, the demographic groups most similar to Americans are Nepalese (82.4%, a difference of 0.0%), Marshallese (82.4%, a difference of 0.010%), Spanish American Indian (82.5%, a difference of 0.080%), Central American Indian (82.5%, a difference of 0.10%), and Tlingit-Haida (82.5%, a difference of 0.16%).
| Demographics | Rating | Rank | In Labor Force | Age 35-44 |
| Immigrants | Lebanon | 0.0 /100 | #295 | Tragic 82.7% |
| Mexican American Indians | 0.0 /100 | #296 | Tragic 82.6% |
| Hmong | 0.0 /100 | #297 | Tragic 82.6% |
| Ottawa | 0.0 /100 | #298 | Tragic 82.6% |
| Tlingit-Haida | 0.0 /100 | #299 | Tragic 82.5% |
| Central American Indians | 0.0 /100 | #300 | Tragic 82.5% |
| Spanish American Indians | 0.0 /100 | #301 | Tragic 82.5% |
| Americans | 0.0 /100 | #302 | Tragic 82.4% |
| Nepalese | 0.0 /100 | #303 | Tragic 82.4% |
| Marshallese | 0.0 /100 | #304 | Tragic 82.4% |
| Shoshone | 0.0 /100 | #305 | Tragic 82.2% |
| Blacks/African Americans | 0.0 /100 | #306 | Tragic 82.2% |
| Hispanics or Latinos | 0.0 /100 | #307 | Tragic 82.1% |
| Immigrants | Central America | 0.0 /100 | #308 | Tragic 82.0% |
| Cree | 0.0 /100 | #309 | Tragic 82.0% |
Demographics Similar to Czechs by In Labor Force | Age 35-44
In terms of in labor force | age 35-44, the demographic groups most similar to Czechs are Bermudan (85.3%, a difference of 0.0%), Immigrants from India (85.3%, a difference of 0.0%), Ugandan (85.3%, a difference of 0.010%), Cambodian (85.3%, a difference of 0.020%), and Immigrants from Nepal (85.3%, a difference of 0.030%).
| Demographics | Rating | Rank | In Labor Force | Age 35-44 |
| Latvians | 99.9 /100 | #24 | Exceptional 85.4% |
| Paraguayans | 99.9 /100 | #25 | Exceptional 85.4% |
| Immigrants | Liberia | 99.9 /100 | #26 | Exceptional 85.4% |
| Immigrants | Lithuania | 99.9 /100 | #27 | Exceptional 85.4% |
| Immigrants | Greece | 99.9 /100 | #28 | Exceptional 85.3% |
| Cambodians | 99.9 /100 | #29 | Exceptional 85.3% |
| Bermudans | 99.9 /100 | #30 | Exceptional 85.3% |
| Czechs | 99.9 /100 | #31 | Exceptional 85.3% |
| Immigrants | India | 99.9 /100 | #32 | Exceptional 85.3% |
| Ugandans | 99.9 /100 | #33 | Exceptional 85.3% |
| Immigrants | Nepal | 99.9 /100 | #34 | Exceptional 85.3% |
| Estonians | 99.9 /100 | #35 | Exceptional 85.3% |
| Immigrants | Morocco | 99.8 /100 | #36 | Exceptional 85.2% |
| Kenyans | 99.8 /100 | #37 | Exceptional 85.2% |
| Immigrants | Poland | 99.8 /100 | #38 | Exceptional 85.2% |