Immigrants from Ghana vs Czech In Labor Force | Age 35-44
COMPARE
Immigrants from Ghana
Czech
In Labor Force | Age 35-44
In Labor Force | Age 35-44 Comparison
Immigrants from Ghana
Czechs
84.7%
IN LABOR FORCE | AGE 35-44
90.4/ 100
METRIC RATING
128th/ 347
METRIC RANK
85.3%
IN LABOR FORCE | AGE 35-44
99.9/ 100
METRIC RATING
31st/ 347
METRIC RANK
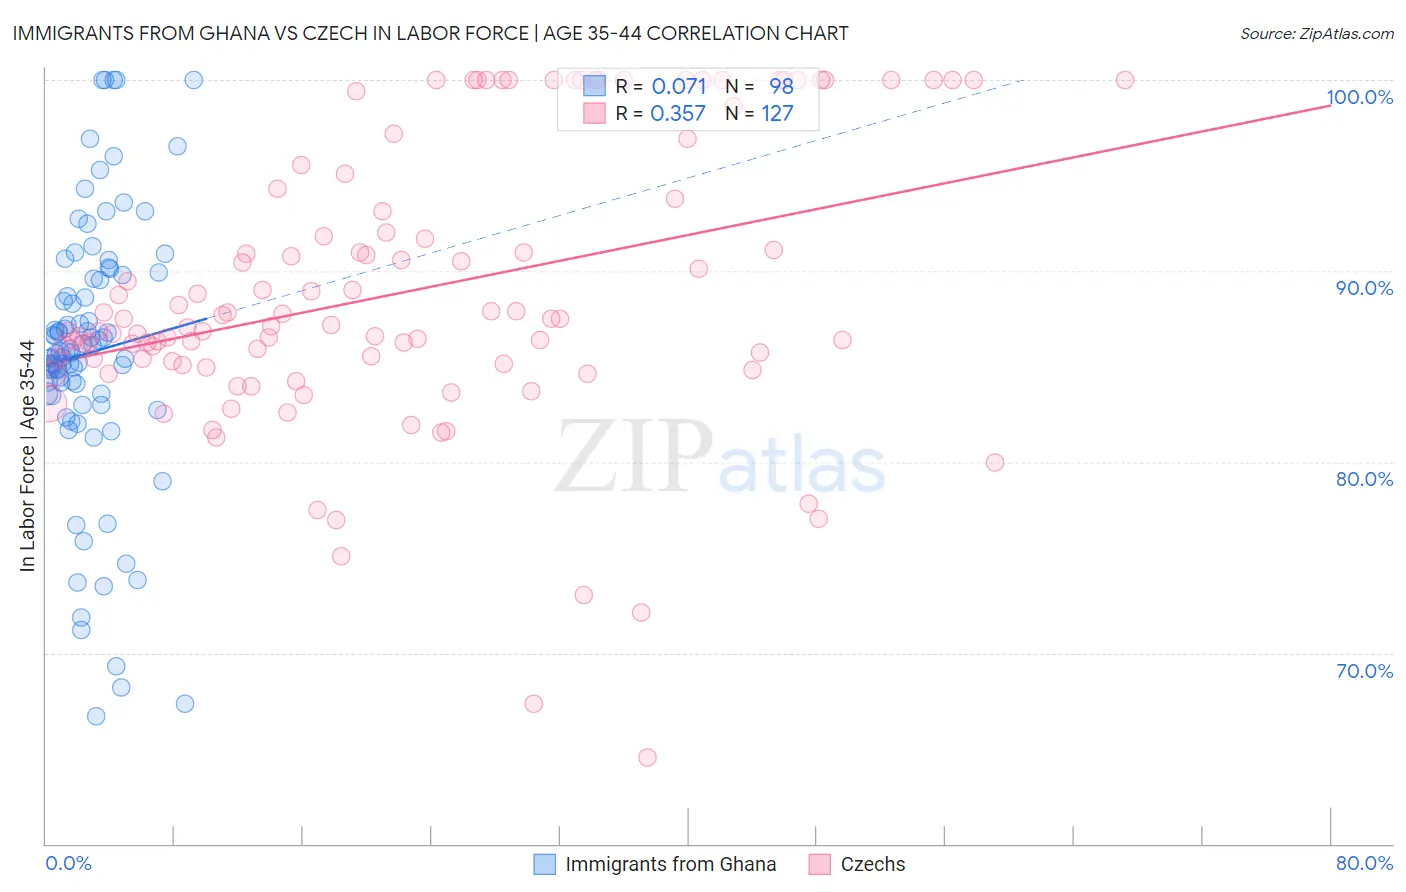
Immigrants from Ghana vs Czech In Labor Force | Age 35-44 Correlation Chart
The statistical analysis conducted on geographies consisting of 199,842,455 people shows a slight positive correlation between the proportion of Immigrants from Ghana and labor force participation rate among population between the ages 35 and 44 in the United States with a correlation coefficient (R) of 0.071 and weighted average of 84.7%. Similarly, the statistical analysis conducted on geographies consisting of 484,520,420 people shows a mild positive correlation between the proportion of Czechs and labor force participation rate among population between the ages 35 and 44 in the United States with a correlation coefficient (R) of 0.357 and weighted average of 85.3%, a difference of 0.74%.
In Labor Force | Age 35-44 Correlation Summary
| Measurement | Immigrants from Ghana | Czech |
| Minimum | 66.7% | 64.5% |
| Maximum | 100.0% | 100.0% |
| Range | 33.3% | 35.5% |
| Mean | 85.7% | 89.0% |
| Median | 85.8% | 87.1% |
| Interquartile 25% (IQ1) | 83.6% | 85.2% |
| Interquartile 75% (IQ3) | 89.6% | 94.3% |
| Interquartile Range (IQR) | 6.0% | 9.1% |
| Standard Deviation (Sample) | 7.0% | 7.4% |
| Standard Deviation (Population) | 7.0% | 7.4% |
Similar Demographics by In Labor Force | Age 35-44
Demographics Similar to Immigrants from Ghana by In Labor Force | Age 35-44
In terms of in labor force | age 35-44, the demographic groups most similar to Immigrants from Ghana are Asian (84.7%, a difference of 0.0%), Immigrants from Spain (84.7%, a difference of 0.0%), German (84.7%, a difference of 0.010%), Immigrants from South America (84.7%, a difference of 0.010%), and Slavic (84.7%, a difference of 0.010%).
| Demographics | Rating | Rank | In Labor Force | Age 35-44 |
| Finns | 91.2 /100 | #121 | Exceptional 84.7% |
| Germans | 91.0 /100 | #122 | Exceptional 84.7% |
| Immigrants | South America | 90.9 /100 | #123 | Exceptional 84.7% |
| Slavs | 90.8 /100 | #124 | Exceptional 84.7% |
| Maltese | 90.8 /100 | #125 | Exceptional 84.7% |
| Asians | 90.6 /100 | #126 | Exceptional 84.7% |
| Immigrants | Spain | 90.6 /100 | #127 | Exceptional 84.7% |
| Immigrants | Ghana | 90.4 /100 | #128 | Exceptional 84.7% |
| Palestinians | 89.7 /100 | #129 | Excellent 84.7% |
| Bhutanese | 89.7 /100 | #130 | Excellent 84.7% |
| Immigrants | Scotland | 89.6 /100 | #131 | Excellent 84.7% |
| Austrians | 89.4 /100 | #132 | Excellent 84.7% |
| Argentineans | 88.4 /100 | #133 | Excellent 84.6% |
| Immigrants | Korea | 88.2 /100 | #134 | Excellent 84.6% |
| Immigrants | Malaysia | 87.5 /100 | #135 | Excellent 84.6% |
Demographics Similar to Czechs by In Labor Force | Age 35-44
In terms of in labor force | age 35-44, the demographic groups most similar to Czechs are Bermudan (85.3%, a difference of 0.0%), Immigrants from India (85.3%, a difference of 0.0%), Ugandan (85.3%, a difference of 0.010%), Cambodian (85.3%, a difference of 0.020%), and Immigrants from Nepal (85.3%, a difference of 0.030%).
| Demographics | Rating | Rank | In Labor Force | Age 35-44 |
| Latvians | 99.9 /100 | #24 | Exceptional 85.4% |
| Paraguayans | 99.9 /100 | #25 | Exceptional 85.4% |
| Immigrants | Liberia | 99.9 /100 | #26 | Exceptional 85.4% |
| Immigrants | Lithuania | 99.9 /100 | #27 | Exceptional 85.4% |
| Immigrants | Greece | 99.9 /100 | #28 | Exceptional 85.3% |
| Cambodians | 99.9 /100 | #29 | Exceptional 85.3% |
| Bermudans | 99.9 /100 | #30 | Exceptional 85.3% |
| Czechs | 99.9 /100 | #31 | Exceptional 85.3% |
| Immigrants | India | 99.9 /100 | #32 | Exceptional 85.3% |
| Ugandans | 99.9 /100 | #33 | Exceptional 85.3% |
| Immigrants | Nepal | 99.9 /100 | #34 | Exceptional 85.3% |
| Estonians | 99.9 /100 | #35 | Exceptional 85.3% |
| Immigrants | Morocco | 99.8 /100 | #36 | Exceptional 85.2% |
| Kenyans | 99.8 /100 | #37 | Exceptional 85.2% |
| Immigrants | Poland | 99.8 /100 | #38 | Exceptional 85.2% |