Potawatomi vs Latvian In Labor Force | Age 30-34
COMPARE
Potawatomi
Latvian
In Labor Force | Age 30-34
In Labor Force | Age 30-34 Comparison
Potawatomi
Latvians
82.8%
IN LABOR FORCE | AGE 30-34
0.0/ 100
METRIC RATING
291st/ 347
METRIC RANK
86.0%
IN LABOR FORCE | AGE 30-34
100.0/ 100
METRIC RATING
16th/ 347
METRIC RANK
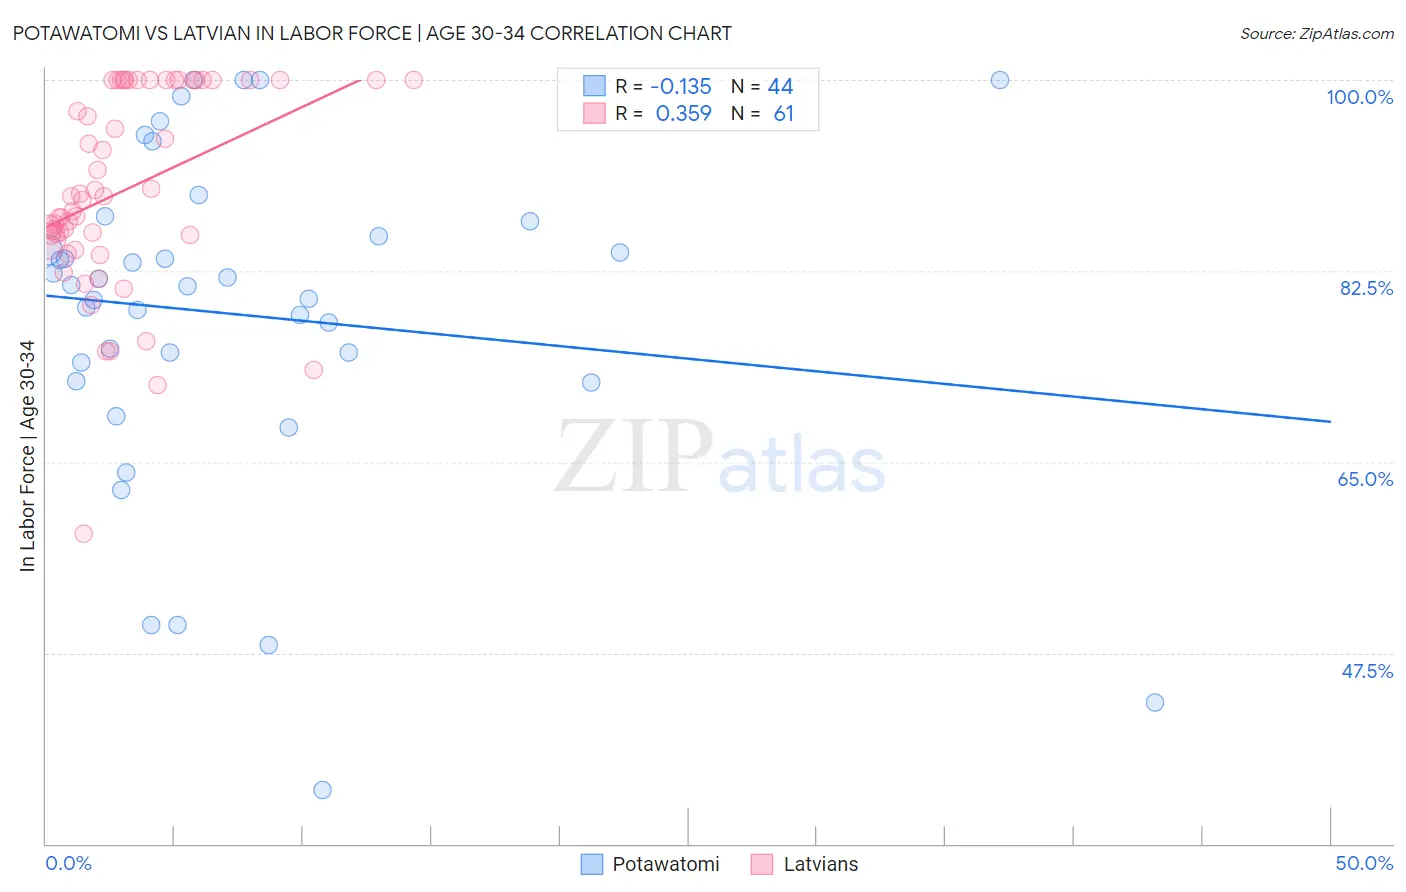
Potawatomi vs Latvian In Labor Force | Age 30-34 Correlation Chart
The statistical analysis conducted on geographies consisting of 117,760,740 people shows a poor negative correlation between the proportion of Potawatomi and labor force participation rate among population between the ages 30 and 34 in the United States with a correlation coefficient (R) of -0.135 and weighted average of 82.8%. Similarly, the statistical analysis conducted on geographies consisting of 220,645,666 people shows a mild positive correlation between the proportion of Latvians and labor force participation rate among population between the ages 30 and 34 in the United States with a correlation coefficient (R) of 0.359 and weighted average of 86.0%, a difference of 3.9%.
In Labor Force | Age 30-34 Correlation Summary
| Measurement | Potawatomi | Latvian |
| Minimum | 34.9% | 58.4% |
| Maximum | 100.0% | 100.0% |
| Range | 65.1% | 41.6% |
| Mean | 78.5% | 90.0% |
| Median | 81.2% | 89.3% |
| Interquartile 25% (IQ1) | 73.3% | 85.5% |
| Interquartile 75% (IQ3) | 86.4% | 100.0% |
| Interquartile Range (IQR) | 13.1% | 14.5% |
| Standard Deviation (Sample) | 15.3% | 9.1% |
| Standard Deviation (Population) | 15.2% | 9.1% |
Similar Demographics by In Labor Force | Age 30-34
Demographics Similar to Potawatomi by In Labor Force | Age 30-34
In terms of in labor force | age 30-34, the demographic groups most similar to Potawatomi are Blackfeet (82.8%, a difference of 0.020%), Black/African American (82.8%, a difference of 0.020%), Nepalese (82.7%, a difference of 0.080%), American (82.7%, a difference of 0.11%), and Pennsylvania German (82.6%, a difference of 0.23%).
| Demographics | Rating | Rank | In Labor Force | Age 30-34 |
| Immigrants | Belize | 0.0 /100 | #284 | Tragic 83.2% |
| Cree | 0.0 /100 | #285 | Tragic 83.2% |
| Immigrants | Latin America | 0.0 /100 | #286 | Tragic 83.1% |
| Native Hawaiians | 0.0 /100 | #287 | Tragic 83.0% |
| Central American Indians | 0.0 /100 | #288 | Tragic 83.0% |
| Hawaiians | 0.0 /100 | #289 | Tragic 83.0% |
| Blackfeet | 0.0 /100 | #290 | Tragic 82.8% |
| Potawatomi | 0.0 /100 | #291 | Tragic 82.8% |
| Blacks/African Americans | 0.0 /100 | #292 | Tragic 82.8% |
| Nepalese | 0.0 /100 | #293 | Tragic 82.7% |
| Americans | 0.0 /100 | #294 | Tragic 82.7% |
| Pennsylvania Germans | 0.0 /100 | #295 | Tragic 82.6% |
| Chippewa | 0.0 /100 | #296 | Tragic 82.6% |
| Comanche | 0.0 /100 | #297 | Tragic 82.6% |
| Aleuts | 0.0 /100 | #298 | Tragic 82.6% |
Demographics Similar to Latvians by In Labor Force | Age 30-34
In terms of in labor force | age 30-34, the demographic groups most similar to Latvians are Immigrants from Cameroon (86.0%, a difference of 0.010%), Immigrants from Albania (86.1%, a difference of 0.030%), Immigrants from Cabo Verde (86.1%, a difference of 0.040%), Immigrants from Sierra Leone (86.0%, a difference of 0.040%), and Bolivian (86.1%, a difference of 0.060%).
| Demographics | Rating | Rank | In Labor Force | Age 30-34 |
| Immigrants | Somalia | 100.0 /100 | #9 | Exceptional 86.2% |
| Immigrants | Serbia | 100.0 /100 | #10 | Exceptional 86.2% |
| Carpatho Rusyns | 100.0 /100 | #11 | Exceptional 86.2% |
| Bolivians | 100.0 /100 | #12 | Exceptional 86.1% |
| Immigrants | Croatia | 100.0 /100 | #13 | Exceptional 86.1% |
| Immigrants | Cabo Verde | 100.0 /100 | #14 | Exceptional 86.1% |
| Immigrants | Albania | 100.0 /100 | #15 | Exceptional 86.1% |
| Latvians | 100.0 /100 | #16 | Exceptional 86.0% |
| Immigrants | Cameroon | 100.0 /100 | #17 | Exceptional 86.0% |
| Immigrants | Sierra Leone | 100.0 /100 | #18 | Exceptional 86.0% |
| Sierra Leoneans | 100.0 /100 | #19 | Exceptional 86.0% |
| Bulgarians | 100.0 /100 | #20 | Exceptional 86.0% |
| Immigrants | Bulgaria | 100.0 /100 | #21 | Exceptional 86.0% |
| Bermudans | 100.0 /100 | #22 | Exceptional 85.9% |
| Estonians | 100.0 /100 | #23 | Exceptional 85.9% |