Paraguayan vs Japanese In Labor Force | Age 30-34
COMPARE
Paraguayan
Japanese
In Labor Force | Age 30-34
In Labor Force | Age 30-34 Comparison
Paraguayans
Japanese
85.8%
IN LABOR FORCE | AGE 30-34
99.9/ 100
METRIC RATING
31st/ 347
METRIC RANK
84.3%
IN LABOR FORCE | AGE 30-34
8.8/ 100
METRIC RATING
211th/ 347
METRIC RANK
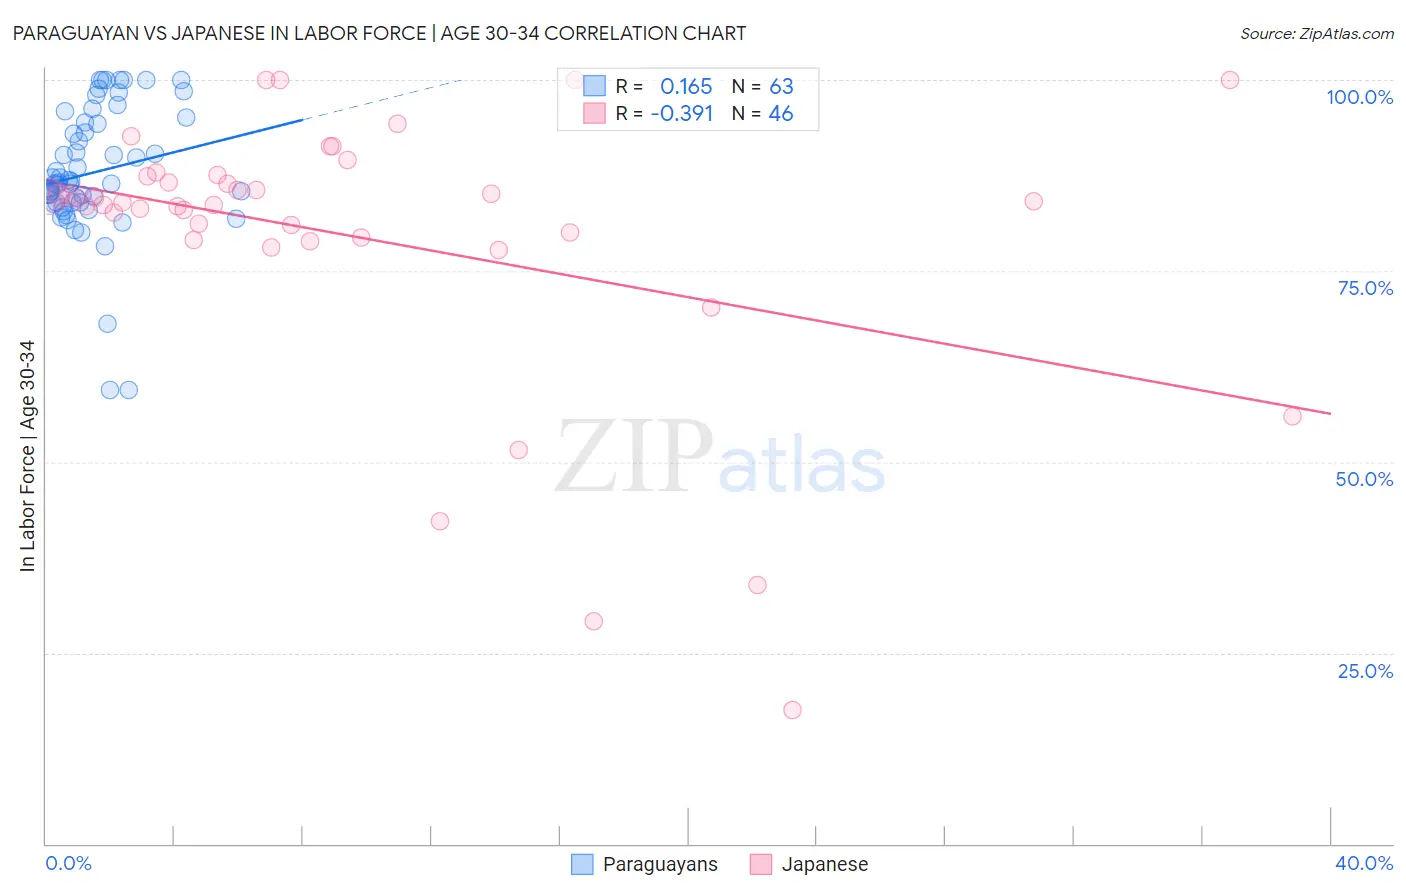
Paraguayan vs Japanese In Labor Force | Age 30-34 Correlation Chart
The statistical analysis conducted on geographies consisting of 95,107,101 people shows a poor positive correlation between the proportion of Paraguayans and labor force participation rate among population between the ages 30 and 34 in the United States with a correlation coefficient (R) of 0.165 and weighted average of 85.8%. Similarly, the statistical analysis conducted on geographies consisting of 249,105,217 people shows a mild negative correlation between the proportion of Japanese and labor force participation rate among population between the ages 30 and 34 in the United States with a correlation coefficient (R) of -0.391 and weighted average of 84.3%, a difference of 1.7%.
In Labor Force | Age 30-34 Correlation Summary
| Measurement | Paraguayan | Japanese |
| Minimum | 59.4% | 17.5% |
| Maximum | 100.0% | 100.0% |
| Range | 40.6% | 82.5% |
| Mean | 87.9% | 79.6% |
| Median | 86.6% | 84.0% |
| Interquartile 25% (IQ1) | 83.9% | 79.4% |
| Interquartile 75% (IQ3) | 94.4% | 87.3% |
| Interquartile Range (IQR) | 10.5% | 8.0% |
| Standard Deviation (Sample) | 8.6% | 17.9% |
| Standard Deviation (Population) | 8.5% | 17.7% |
Similar Demographics by In Labor Force | Age 30-34
Demographics Similar to Paraguayans by In Labor Force | Age 30-34
In terms of in labor force | age 30-34, the demographic groups most similar to Paraguayans are Cypriot (85.8%, a difference of 0.0%), Immigrants from Hong Kong (85.8%, a difference of 0.020%), Tsimshian (85.8%, a difference of 0.050%), Immigrants from Bosnia and Herzegovina (85.8%, a difference of 0.050%), and Ugandan (85.8%, a difference of 0.050%).
| Demographics | Rating | Rank | In Labor Force | Age 30-34 |
| Immigrants | Eritrea | 100.0 /100 | #24 | Exceptional 85.9% |
| Immigrants | North Macedonia | 100.0 /100 | #25 | Exceptional 85.9% |
| Immigrants | Eastern Africa | 100.0 /100 | #26 | Exceptional 85.9% |
| Immigrants | Liberia | 100.0 /100 | #27 | Exceptional 85.9% |
| Immigrants | Latvia | 100.0 /100 | #28 | Exceptional 85.9% |
| Tsimshian | 100.0 /100 | #29 | Exceptional 85.8% |
| Immigrants | Hong Kong | 100.0 /100 | #30 | Exceptional 85.8% |
| Paraguayans | 99.9 /100 | #31 | Exceptional 85.8% |
| Cypriots | 99.9 /100 | #32 | Exceptional 85.8% |
| Immigrants | Bosnia and Herzegovina | 99.9 /100 | #33 | Exceptional 85.8% |
| Ugandans | 99.9 /100 | #34 | Exceptional 85.8% |
| Serbians | 99.9 /100 | #35 | Exceptional 85.8% |
| Albanians | 99.9 /100 | #36 | Exceptional 85.7% |
| Norwegians | 99.9 /100 | #37 | Exceptional 85.7% |
| Immigrants | Greece | 99.9 /100 | #38 | Exceptional 85.7% |
Demographics Similar to Japanese by In Labor Force | Age 30-34
In terms of in labor force | age 30-34, the demographic groups most similar to Japanese are Arab (84.3%, a difference of 0.0%), Jamaican (84.3%, a difference of 0.0%), Indonesian (84.3%, a difference of 0.0%), Bangladeshi (84.3%, a difference of 0.010%), and Immigrants from Western Asia (84.3%, a difference of 0.010%).
| Demographics | Rating | Rank | In Labor Force | Age 30-34 |
| Ecuadorians | 14.2 /100 | #204 | Poor 84.4% |
| French | 13.8 /100 | #205 | Poor 84.4% |
| Lebanese | 10.6 /100 | #206 | Poor 84.4% |
| Bangladeshis | 9.4 /100 | #207 | Tragic 84.3% |
| Arabs | 8.9 /100 | #208 | Tragic 84.3% |
| Jamaicans | 8.8 /100 | #209 | Tragic 84.3% |
| Indonesians | 8.8 /100 | #210 | Tragic 84.3% |
| Japanese | 8.8 /100 | #211 | Tragic 84.3% |
| Immigrants | Western Asia | 8.2 /100 | #212 | Tragic 84.3% |
| Immigrants | Jamaica | 7.9 /100 | #213 | Tragic 84.3% |
| Immigrants | Germany | 7.2 /100 | #214 | Tragic 84.3% |
| Europeans | 7.2 /100 | #215 | Tragic 84.3% |
| Immigrants | Ecuador | 7.1 /100 | #216 | Tragic 84.3% |
| Immigrants | Trinidad and Tobago | 7.0 /100 | #217 | Tragic 84.3% |
| Immigrants | Panama | 6.3 /100 | #218 | Tragic 84.3% |