Immigrants from Sudan vs Latvian In Labor Force | Age 30-34
COMPARE
Immigrants from Sudan
Latvian
In Labor Force | Age 30-34
In Labor Force | Age 30-34 Comparison
Immigrants from Sudan
Latvians
84.8%
IN LABOR FORCE | AGE 30-34
69.5/ 100
METRIC RATING
155th/ 347
METRIC RANK
86.0%
IN LABOR FORCE | AGE 30-34
100.0/ 100
METRIC RATING
16th/ 347
METRIC RANK
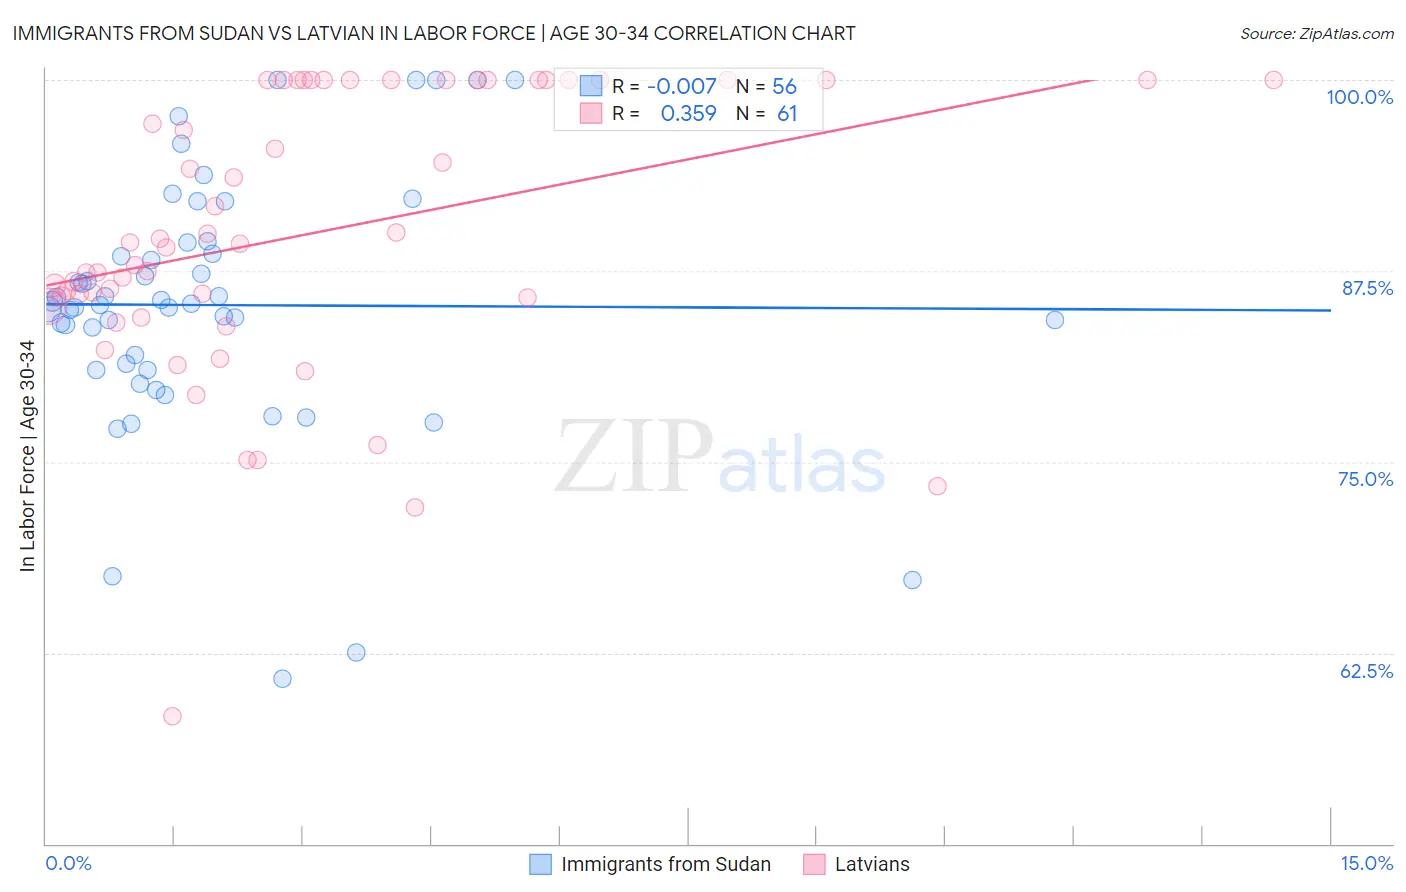
Immigrants from Sudan vs Latvian In Labor Force | Age 30-34 Correlation Chart
The statistical analysis conducted on geographies consisting of 118,954,607 people shows no correlation between the proportion of Immigrants from Sudan and labor force participation rate among population between the ages 30 and 34 in the United States with a correlation coefficient (R) of -0.007 and weighted average of 84.8%. Similarly, the statistical analysis conducted on geographies consisting of 220,645,666 people shows a mild positive correlation between the proportion of Latvians and labor force participation rate among population between the ages 30 and 34 in the United States with a correlation coefficient (R) of 0.359 and weighted average of 86.0%, a difference of 1.5%.
In Labor Force | Age 30-34 Correlation Summary
| Measurement | Immigrants from Sudan | Latvian |
| Minimum | 60.8% | 58.4% |
| Maximum | 100.0% | 100.0% |
| Range | 39.2% | 41.6% |
| Mean | 85.3% | 90.0% |
| Median | 85.3% | 89.3% |
| Interquartile 25% (IQ1) | 81.2% | 85.5% |
| Interquartile 75% (IQ3) | 89.0% | 100.0% |
| Interquartile Range (IQR) | 7.8% | 14.5% |
| Standard Deviation (Sample) | 8.4% | 9.1% |
| Standard Deviation (Population) | 8.3% | 9.1% |
Similar Demographics by In Labor Force | Age 30-34
Demographics Similar to Immigrants from Sudan by In Labor Force | Age 30-34
In terms of in labor force | age 30-34, the demographic groups most similar to Immigrants from Sudan are Syrian (84.8%, a difference of 0.0%), Northern European (84.8%, a difference of 0.0%), French Canadian (84.8%, a difference of 0.020%), Romanian (84.8%, a difference of 0.030%), and Peruvian (84.8%, a difference of 0.030%).
| Demographics | Rating | Rank | In Labor Force | Age 30-34 |
| Immigrants | Pakistan | 76.2 /100 | #148 | Good 84.9% |
| Immigrants | Ukraine | 75.1 /100 | #149 | Good 84.8% |
| Germans | 75.1 /100 | #150 | Good 84.8% |
| Immigrants | Senegal | 74.0 /100 | #151 | Good 84.8% |
| Romanians | 73.5 /100 | #152 | Good 84.8% |
| Syrians | 70.1 /100 | #153 | Good 84.8% |
| Northern Europeans | 70.0 /100 | #154 | Good 84.8% |
| Immigrants | Sudan | 69.5 /100 | #155 | Good 84.8% |
| French Canadians | 67.3 /100 | #156 | Good 84.8% |
| Peruvians | 65.9 /100 | #157 | Good 84.8% |
| Immigrants | Armenia | 64.7 /100 | #158 | Good 84.8% |
| Czechoslovakians | 63.0 /100 | #159 | Good 84.8% |
| Pakistanis | 60.8 /100 | #160 | Good 84.7% |
| Immigrants | Cambodia | 60.7 /100 | #161 | Good 84.7% |
| South Americans | 58.7 /100 | #162 | Average 84.7% |
Demographics Similar to Latvians by In Labor Force | Age 30-34
In terms of in labor force | age 30-34, the demographic groups most similar to Latvians are Immigrants from Cameroon (86.0%, a difference of 0.010%), Immigrants from Albania (86.1%, a difference of 0.030%), Immigrants from Cabo Verde (86.1%, a difference of 0.040%), Immigrants from Sierra Leone (86.0%, a difference of 0.040%), and Bolivian (86.1%, a difference of 0.060%).
| Demographics | Rating | Rank | In Labor Force | Age 30-34 |
| Immigrants | Somalia | 100.0 /100 | #9 | Exceptional 86.2% |
| Immigrants | Serbia | 100.0 /100 | #10 | Exceptional 86.2% |
| Carpatho Rusyns | 100.0 /100 | #11 | Exceptional 86.2% |
| Bolivians | 100.0 /100 | #12 | Exceptional 86.1% |
| Immigrants | Croatia | 100.0 /100 | #13 | Exceptional 86.1% |
| Immigrants | Cabo Verde | 100.0 /100 | #14 | Exceptional 86.1% |
| Immigrants | Albania | 100.0 /100 | #15 | Exceptional 86.1% |
| Latvians | 100.0 /100 | #16 | Exceptional 86.0% |
| Immigrants | Cameroon | 100.0 /100 | #17 | Exceptional 86.0% |
| Immigrants | Sierra Leone | 100.0 /100 | #18 | Exceptional 86.0% |
| Sierra Leoneans | 100.0 /100 | #19 | Exceptional 86.0% |
| Bulgarians | 100.0 /100 | #20 | Exceptional 86.0% |
| Immigrants | Bulgaria | 100.0 /100 | #21 | Exceptional 86.0% |
| Bermudans | 100.0 /100 | #22 | Exceptional 85.9% |
| Estonians | 100.0 /100 | #23 | Exceptional 85.9% |