Panamanian vs Nonimmigrants In Labor Force | Age 20-64
COMPARE
Panamanian
Nonimmigrants
In Labor Force | Age 20-64
In Labor Force | Age 20-64 Comparison
Panamanians
Nonimmigrants
79.1%
IN LABOR FORCE | AGE 20-64
5.7/ 100
METRIC RATING
228th/ 347
METRIC RANK
78.1%
IN LABOR FORCE | AGE 20-64
0.0/ 100
METRIC RATING
283rd/ 347
METRIC RANK
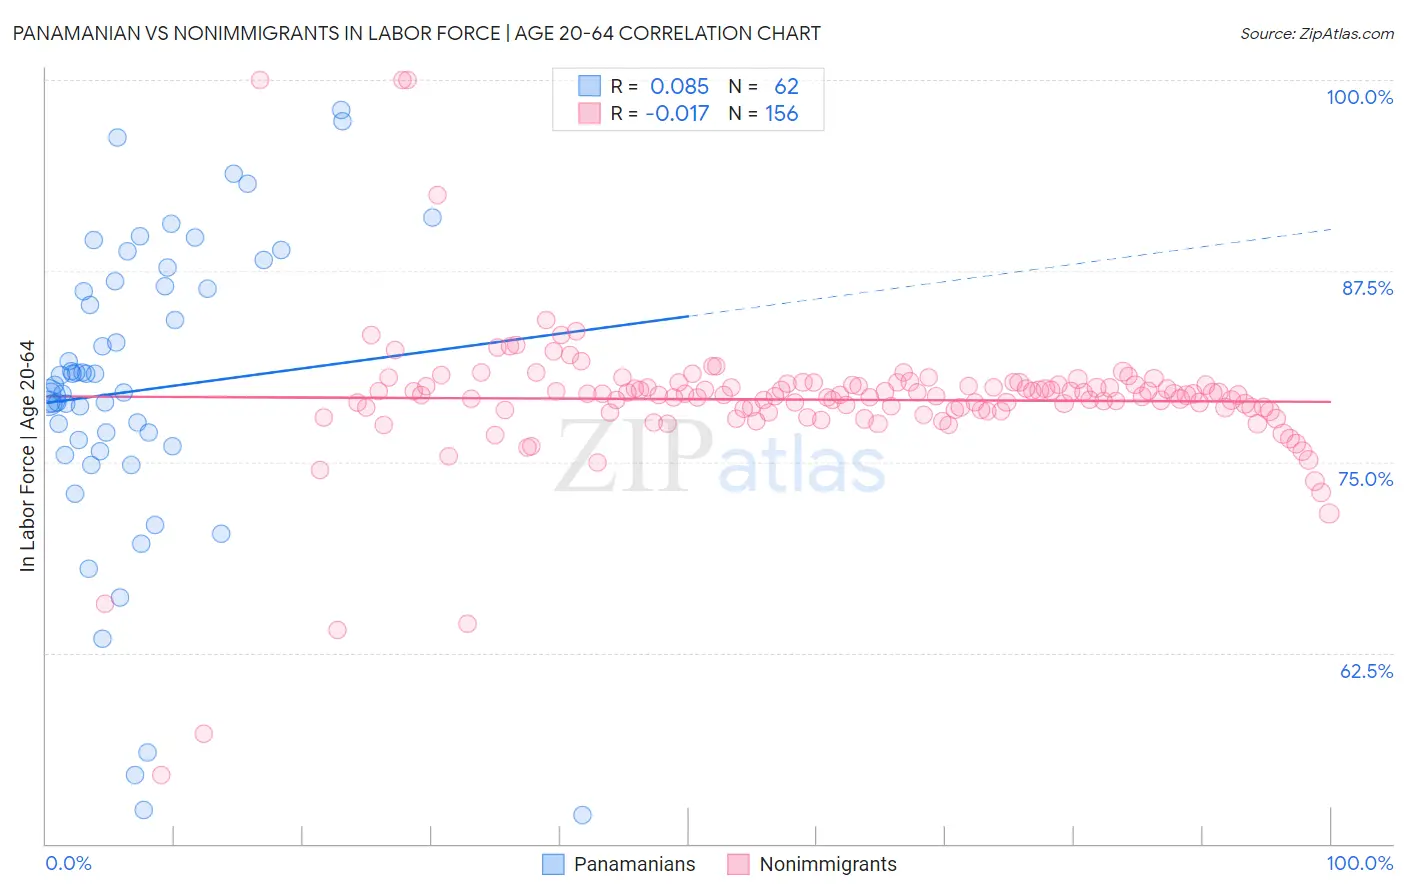
Panamanian vs Nonimmigrants In Labor Force | Age 20-64 Correlation Chart
The statistical analysis conducted on geographies consisting of 281,243,301 people shows a slight positive correlation between the proportion of Panamanians and labor force participation rate among population between the ages 20 and 64 in the United States with a correlation coefficient (R) of 0.085 and weighted average of 79.1%. Similarly, the statistical analysis conducted on geographies consisting of 585,321,866 people shows no correlation between the proportion of Nonimmigrants and labor force participation rate among population between the ages 20 and 64 in the United States with a correlation coefficient (R) of -0.017 and weighted average of 78.1%, a difference of 1.3%.
In Labor Force | Age 20-64 Correlation Summary
| Measurement | Panamanian | Nonimmigrants |
| Minimum | 51.9% | 54.5% |
| Maximum | 98.0% | 100.0% |
| Range | 46.1% | 45.5% |
| Mean | 79.7% | 79.1% |
| Median | 79.8% | 79.4% |
| Interquartile 25% (IQ1) | 76.0% | 78.4% |
| Interquartile 75% (IQ3) | 86.5% | 80.0% |
| Interquartile Range (IQR) | 10.5% | 1.7% |
| Standard Deviation (Sample) | 10.1% | 4.9% |
| Standard Deviation (Population) | 10.0% | 4.9% |
Similar Demographics by In Labor Force | Age 20-64
Demographics Similar to Panamanians by In Labor Force | Age 20-64
In terms of in labor force | age 20-64, the demographic groups most similar to Panamanians are Alsatian (79.1%, a difference of 0.0%), Native Hawaiian (79.1%, a difference of 0.0%), Central American (79.1%, a difference of 0.010%), Immigrants from Western Europe (79.1%, a difference of 0.010%), and Portuguese (79.1%, a difference of 0.020%).
| Demographics | Rating | Rank | In Labor Force | Age 20-64 |
| Hungarians | 7.2 /100 | #221 | Tragic 79.2% |
| Immigrants | Panama | 6.9 /100 | #222 | Tragic 79.1% |
| Canadians | 6.8 /100 | #223 | Tragic 79.1% |
| Immigrants | Uzbekistan | 6.8 /100 | #224 | Tragic 79.1% |
| Portuguese | 6.4 /100 | #225 | Tragic 79.1% |
| Central Americans | 5.9 /100 | #226 | Tragic 79.1% |
| Immigrants | Western Europe | 5.9 /100 | #227 | Tragic 79.1% |
| Panamanians | 5.7 /100 | #228 | Tragic 79.1% |
| Alsatians | 5.7 /100 | #229 | Tragic 79.1% |
| Native Hawaiians | 5.6 /100 | #230 | Tragic 79.1% |
| Lebanese | 5.1 /100 | #231 | Tragic 79.1% |
| Guamanians/Chamorros | 4.5 /100 | #232 | Tragic 79.1% |
| Japanese | 4.0 /100 | #233 | Tragic 79.1% |
| Immigrants | Canada | 3.2 /100 | #234 | Tragic 79.0% |
| Tlingit-Haida | 3.2 /100 | #235 | Tragic 79.0% |
Demographics Similar to Nonimmigrants by In Labor Force | Age 20-64
In terms of in labor force | age 20-64, the demographic groups most similar to Nonimmigrants are Immigrants from St. Vincent and the Grenadines (78.1%, a difference of 0.010%), Immigrants from Guyana (78.1%, a difference of 0.010%), Guyanese (78.1%, a difference of 0.030%), Immigrants from Dominica (78.1%, a difference of 0.060%), and Belizean (78.2%, a difference of 0.11%).
| Demographics | Rating | Rank | In Labor Force | Age 20-64 |
| Puget Sound Salish | 0.0 /100 | #276 | Tragic 78.2% |
| Immigrants | Bahamas | 0.0 /100 | #277 | Tragic 78.2% |
| Mexican American Indians | 0.0 /100 | #278 | Tragic 78.2% |
| Belizeans | 0.0 /100 | #279 | Tragic 78.2% |
| Immigrants | Dominica | 0.0 /100 | #280 | Tragic 78.1% |
| Guyanese | 0.0 /100 | #281 | Tragic 78.1% |
| Immigrants | St. Vincent and the Grenadines | 0.0 /100 | #282 | Tragic 78.1% |
| Immigrants | Nonimmigrants | 0.0 /100 | #283 | Tragic 78.1% |
| Immigrants | Guyana | 0.0 /100 | #284 | Tragic 78.1% |
| Osage | 0.0 /100 | #285 | Tragic 78.0% |
| Immigrants | Belize | 0.0 /100 | #286 | Tragic 78.0% |
| Vietnamese | 0.0 /100 | #287 | Tragic 78.0% |
| Hmong | 0.0 /100 | #288 | Tragic 77.9% |
| Africans | 0.0 /100 | #289 | Tragic 77.9% |
| Immigrants | Bangladesh | 0.0 /100 | #290 | Tragic 77.9% |